Production Possibilities for a Nation
- Details
- Category: Economics
- Hits: 9,621
Managing Complexity
The U.S. economy consists of millions of buyers and sellers of goods and services. Think about all the economic activity near where you live. Even in a small town there are dozens of businesses, hundreds of workers, and thousands of items that could be purchased on any given day. You could not possibly keep track of all the decisions that affect the economy of a small town.
Now imagine the number of decisions that affect the economy of an entire country. On eBay alone, more than $1,000 worth of products are traded every second! Even if computers could track everything that goes on in an economy, that information would not be enough to explain the underlying behavior. Data on production and sales could not explain why these activities take place or how they would change in response to new developments, such as an increase in the price of oil. To gain understanding we must boil the complexity of the economy down to a manageable level. Economists do that with models.
Economic models
A model is a simplified representation of reality. For example, a roadmap is a model because it leaves out details such as buildings, trees, and bumps in the road. It shows you the key streets and highways that will get you from where you are to where you want to be. The lack of details makes a roadmap less realistic but more useful. In economics, we use models to focus on a few aspects of the real world. In the same way, a good economic model leaves out many details of the real world but helps you focus on what is important and find your way in the world of economics.
Economic models are used to understand and predict economic activity. Just as one map helps you find your way around town and another helps you find your way around a new school, it takes different models to help you understand different principles of economics. You are about to learn the first of several models introduced in this book. The production possibilities frontier model will allow you to visualize and better understand the tradeoffs a country makes when using its scarce resources.
The production possibilities frontier model
Consider a basic choice every country faces: how to divide its scarce resources among different types of production. In a 1976 speech about military threats from the Soviet Union, British prime minister Margaret Thatcher stated, “The Soviets put guns over butter, but we put almost everything over guns.” Like many countries, Britain was struggling with the division of resources between goods and services for general consumption, represented by butter, and goods and services for use by the military, represented by guns. We will continue with that symbolic use of guns and butter.
Imagine a country that produces only guns and butter. Of course, no country produces just two goods, but a realistic model with millions of goods and services would be hard to work with! The table in Figure 2.1 shows several quantities of butter that the country could choose to produce in a week.
For each listed quantity of butter, the table also shows the largest quantity of guns that could be made with the resources not used to make butter. For example, the row labeled A indicates that if the country makes no butter and uses all of its resources to make guns, it can produce 1,000 guns. Row B indicates that if the country makes 100 tons of butter, there will be enough resources left to make only 900 guns.
If you run your finger down the column for butter, you’ll see that as you move from row to row, butter production increases. But producing more butter requires the country to pull resources out of gun production, so gun production falls. Finally, when you arrive at row F, the country uses all of its resources for butter and produces 500 tons. Because no resources are left for guns, no guns can be made. The graph in Figure 2.1 shows the country’s production possibilities frontier.
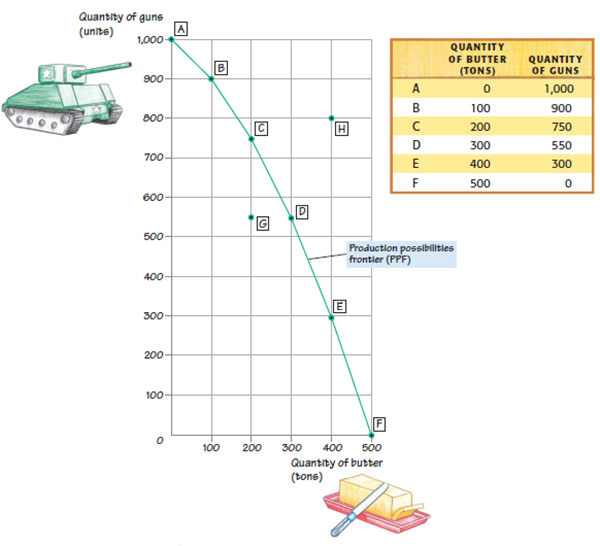
Figure 2.1 Production Possibilities Frontier
As we make larger quantities of consumer goods like butter, fewer resources are available to make military goods like guns.
The production possibilities frontier, or PPF, is a curve that shows the maximum quantity of one good that can be produced for each possible quantity of another good produced. The quantity of butter is measured on the horizontal axis and the quantity of guns is measured on the vertical axis. Each labeled point on the graph corresponds to a row of the table. For example, the point labeled B on the graph represents the information in the row labeled B in the table. At point B, the graph shows that along with 100 tons of butter, at most 900 guns can be made.
The production possibilities frontier is the smooth curve connecting points A through F. Between the labeled points on the curve are many unlabeled points that also represent combinations of a quantity of butter and a quantity of guns that can be made using all available resources. The word frontier means “boundary” or “border,” and the production possibilities frontier represents a border between what the country can produce and what it cannot produce using the available resources.
The country can choose the production levels represented by any point on the PPF. It can also choose any point inside the PPF. For example, point G represents a combination of 200 tons of butter and 550 guns. The country could produce at point G if it wanted to. But the PPF shows us that if 200 tons of butter are produced, the country has enough resources to produce 750 guns (point C). So the country would prefer to make better use of its resources and produce at point C rather than at point G. In general, a country is better off producing on the production possibilities frontier instead of inside it. A point outside the PPF, such as point H, is unattainable— there are not enough resources available to produce the combination of goods that point H represents.
The opportunity cost for society
“There is no such thing as a free lunch.” Have you ever heard that saying? Economist Milton Friedman used it to refer to the practice at some schools of providing free lunches to students. Friedman pointed out that even if the lunch appears to be free to the students who eat it, it is not really free to society. Producing a meal requires resources. As you now know, those resources could have been used for something else. So to have more “free lunches,” we must have less of some other goods or services. We cannot pretend that school lunches or other items are really free when society faces tradeoffs to provide them. Even goods that are “free” to individuals usually take time to produce and have an opportunity cost for society.
The production possibilities frontier allows us to visualize a country’s opportunity cost when it produces more of one good. Continuing with our story of guns and butter, suppose the country starts at point C in Figure 2.2, producing 200 tons of butter and 750 guns. What is the opportunity cost of producing 100 more tons of butter? Producing more butter would require the country to move rightward and downward along the production possibilities frontier, in this case from point C to point D. At point D, the country produces 300 tons of butter, 100 more tons than at point C. It also produces 550 guns at point D, 200 fewer than at point C. So the opportunity cost of the additional 100 tons of butter is 200 guns. This is because to produce 100 more tons of butter, the country gives up 200 guns.
The production possibilities frontier shows that to have more butter, the country must give up some guns. The guns sacrificed are the opportunity cost of more butter. We could also reverse the example. Suppose the country, starting at point C, decides that it wants more guns instead of more butter. Then it will have to move leftward and upward along the PPF, to a point like B. Gun production will increase, but butter production will decrease. In this case, the country sacrifices 100 tons of butter for 150 more guns. The butter it gives up is the opportunity cost of the additional guns.
The Law of Increasing Opportunity Cost
Maybe you’ve heard of Murphy’s Law: if something can go wrong, it will. This type of law is not written by lawmakers or enforced by police; it is called a “law” simply because it is so commonly observed.
Economists have laws like that, too. Notice the shape of the production possibilities frontier in Figure 2.2. It is curved like the right half of a rainbow.
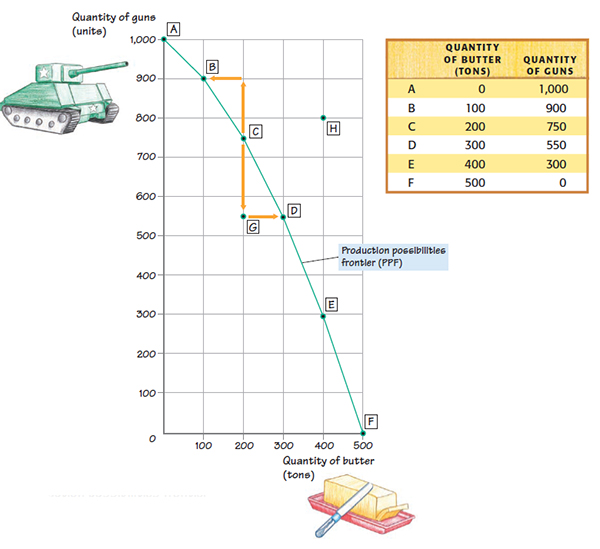
Figure 2.2 Production Possibilities Frontier
The production possibilities frontier illustrates opportunity costs: looking along the frontier, we see that as more of one good is made, the country must make less of another.
The numbers in the table determine this shape. As we go down the table, butter production increases by a constant 100 tons in each new row. But notice that gun production falls by larger and larger amounts each time butter production increases by 100 tons. For example, moving from row A to row B (or point A to point B along the PPF), butter production rises by 100 tons, and gun production falls by 100, from 1,000 to 900. So the opportunity cost of the first 100 tons of butter is 100 guns. What if we move from row B to row C?
While butter production again rises by 100 tons, gun production falls by 150, from 900 to 750. So the opportunity cost of the second 100 tons of butter is 150 guns. As you continue down the rows, the opportunity cost of an additional 100 tons of butter continually increases. The more butter we produce, the greater the opportunity cost of producing still more butter.
The tendency for the opportunity cost of a good to rise as more of the good is produced is called the law of increasing opportunity cost. This is the first of several economic “laws” you will learn in this book. Note that the conditions for economic laws are not always met and these laws do not hold 100 percent of the time. However, learning the laws of economic behavior can help you understand a great deal about how the economy works.
What is behind the law of increasing opportunity cost? Why does the opportunity cost of butter increase as more butter is produced? The reason is that some resources are better suited for one type of production than for another. For example, some of a country’s land is very well suited to raise dairy cows needed to make butter. In the United States, that land is known as Wisconsin. Other land, such as a desert, would make raising dairy cows a struggle but is a fine place for a gun factory. Labor is also specialized. Some workers are happy and productive working on a dairy farm.
Others can’t stand the smell of manure but are high achievers in a factory setting. As for capital, those red barns and milking machines are less than ideal for making guns, and the metal stamping machines used to form guns aren’t great for milking cows.
Let’s apply these ideas to the guns and butter PPF by examining Figure 2.3. Suppose a country begins at point A, where it produces only guns but no butter. At point A, all of the country’s resources are used to make guns. Even those resources that would be much more useful for making butter, such as farmers and their equipment, are employed in gun production. Now suppose the country decides to produce butter, too. To make its first 100 tons of butter, moving from A to B, the country will have to shift resources out of gun production and into butter production.
To make as much as possible of both goods, it will shift those resources that are the most useful for making butter and the least useful for making guns—those farmers and barns and milking machines. Gun production will not fall much, because the resources taken away were not doing a lot of good in gun production anyway. So the opportunity cost of the first 100 tons of butter is only 100 guns.
Now suppose the country wants to produce an additional 100 tons of butter, moving from point B to point C. This time, the country will have to shift some resources that are better suited for making guns— and less suited for making butter— than the resources it shifted before. Shifting away these resources will cause gun production to fall by even more than before.
This is why, as the figure shows, the opportunity cost of moving from point B to point C is 150 guns, which is higher than the opportunity cost of moving from point A to point B. Likewise, the law of increasing opportunity cost applies to any further increases in butter production as well: the more butter the country is already producing, the greater the opportunity cost of producing more butter.
An economy must choose where to operate among the many possible points on its current production possibilities frontier. That is, a country must decide how much food and how much other stuff to make. There are also decisions to be made between types of food, like pizza and tofu, and types of other stuff, like cars and education. How are these decisions made? That depends on how the economy is organized.
In the United States, the choices of individuals play an important role. If more people decide to purchase a college education than a car, more resources are devoted to education services than car manufacturing.
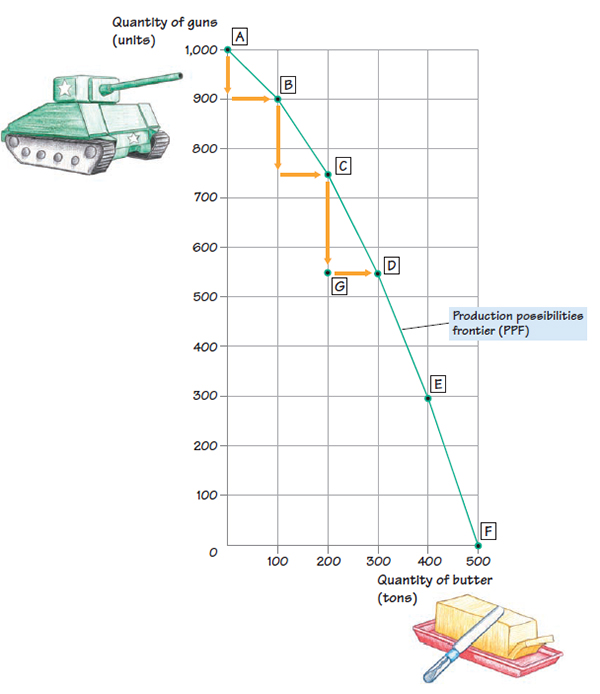
Figure 2.3 Opportunity Costs
The first 100 tons of butter are made with resources specialized for making butter and of little use for making guns, so the opportunity cost is only 100 guns. As more and more butter is made, it must be made using resources better and better suited for making guns, so the opportunity cost rises.
Some of these decisions are also made by your elected government officials, who decide how much money is spent on bridges and roads and those guns we discussed for the military. In Chapter 6 you’ll learn how increases in the demand for a good or service increase prices and signal producers to provide more of it. Chapter 2 explains other systems countries use to divide their limited resources among education, cars, food, and all other stuff.
Efficiency and growth
More than one billion people in the world today do not have enough health care, education, food, or housing to lead a healthy and happy life. Billions more would be happier if more goods and services were available to them. If you would enjoy going to more concerts, riding faster trains, or owning more electronic gadgets, for example, then you can count yourself in that group. This section uses the production possibilities frontier to explain how efficiency and economic growth help satisfy more needs and wants.
Efficiency and Inefficiency
Suppose you’re on the track team and your favorite event is the mile. Your friend on the track team, who runs just as fast as you in each event, has no preference between the mile and the 100- meter dash. It would be unfortunate if your coach signed you up to run the 100- meter dash and had your friend run the mile. By switching your events, you would be made better off and your friend would be no worse off. Efforts to achieve efficiency are about finding opportunities to make improvements such as this.
The economy of a country is efficient if the country takes every opportunity to make some people better off without making other people worse off. This means the country is getting the most out of its available resources. It would be inefficient to use more resources than necessary to produce a good. By eliminating such waste, more of at least one good could be made available to customers without making less of other goods.
Suppose the providers of cable Internet access in a country send two workers to connect each home with Internet service, even though one worker could do the job just as quickly. Production in this country would be inefficient. If the cable companies adopted the efficient method of sending one worker instead, fewer workers would be needed in the cable industry and the country could expand its production of other goods or services. You can see why in Figure 2.4.
In this model, a country uses all of its resources to produce one of two things: Internet connections or T-shirts. Point A represents the combination of connections and T-shirts made when cable companies send two workers to connect each home: 500 homes are connected and 1,000 T-shirts are produced in a week. Notice that point A lies in the area below the production possibilities frontier.
This area represents points at which production is inefficient. At any point below the frontier, the country is not getting the most from its resources because more of at least one good could be made without sacrificing any of the other. By changing how resources are used— in this case, by sending only one cable worker to each home— the country could move to a point on its production possibilities frontier.
For example, the labor freed up by sending only one worker to each home could be used in the cable industry to connect more homes. This could move the country from point A to point D. Or the extra labor could be used to make more T-shirts, and production would move from point A to point B. As a third option, the extra labor could be split between the two industries to make more T-shirts and connect more homes. In this case, the country would move from point A to a point like C.
When production is inefficient, it is possible to produce more of at least one good without producing less of any other good. Once operating on its production possibilities frontier, as we have seen, a country can make more of one good only by making less of another. Because movements along the frontier offer no opportunities for gains without corresponding losses, production is efficient at every point on the production possibilities frontier. Outside the frontier are points the country can only wish for.
These points are out of reach because the country does not have enough resources to produce at those levels. Later in this module we’ll consider ways to reach those points.
Idle Resources
At times, a country’s entire economy goes a bit haywire, and production falls in many industries at the same time. For example, from 2007 to 2009, production of many goods and services decreased in the United States, in Europe, and in many other countries. (You’ll learn why this happened in Chapter 13.) With fewer goods and services being produced, fewer workers were needed to produce them.
Less capital was needed, so many factories shut down, assembly lines sat motionless, and computers were unplugged. At times like this, an economy has idle resources, which are resources that could be used to make some good or service but are not being used to produce anything.
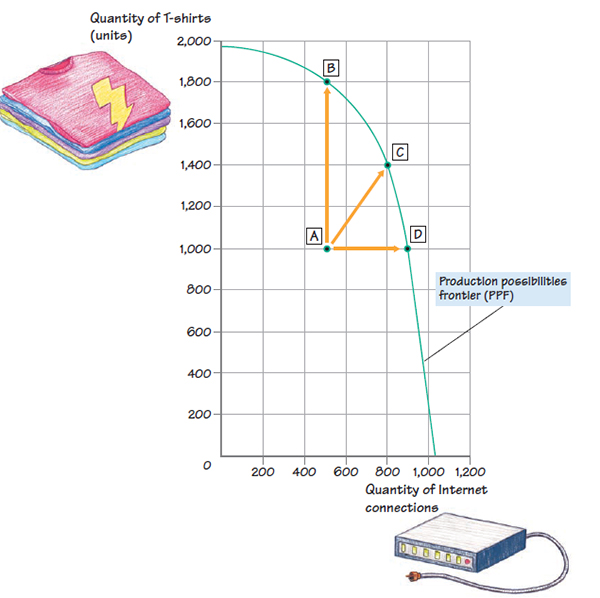
Figure 2.4 Efficiency in Production
It would be inefficient for a country to produce at a point below the production possibilities frontier, as shown by point A. Among the better alternatives are points B, C, and D. At point B, more T- shirts could be made without giving up any Internet connections. At point D, more Internet connections could be provided without decreasing the quantity of T- shirts. And at point C, more T- shirts and more Internet connections could be produced.
Idle resources cause a country to operate below its production possibilities frontier. As with inefficient production, idle resources result in production at a point like A in Figure 2.4. However, the reasons for being inside the production possibilities frontier instead of on it are different. When production is inefficient, the country might be using all of its resources, yet it is not using them in the most productive way. This is true, for instance, when two cable installers are sent out to do the work of one. When resources are idle, the resources that are actually in use might be employed as productively as possible, but other resources are sitting on the sidelines— perhaps some factories are closed or some workers are unemployed.
When a country has idle resources, it can produce more goods and services simply by putting those idle resources to use. There is no need to shift resources out of the production of one good to make more of another. So as with inefficiency, the usual opportunity cost of production does not apply when there are idle resources.
Economic Growth
Time cures all wounds, or so they say, but can it help with problems of resource scarcity? Yes! Most countries experience economic growth, which is an increase in the ability to produce goods and services over time. One source of economic growth is an increase in resources. For example, if a population grows over time, the labor supply generally increases as well. A country’s physical capital can increase with investments in new factories, office buildings, machinery, and stores. Human capital rises with educational opportunities (thank you for reading this book in the service of your country). With more resources available, a country can produce more goods and services.
Consider the Internet connections discussed above. It’s clear that more connections can be provided with more workers, more vans for the cable workers to drive, or more training that helps the workers complete a connection faster. Another source of economic growth is the discovery of new ways to produce goods and services using fewer resources.
Wi-Fi technology that sends Internet signals through the air has allowed far more people to connect their computers to the Internet and reduced the need for workers, vans, and training classes. And think about the resource-saving changes in the way people buy and sell music. It used to be that if you wanted to buy music, you had to go to a store and buy a compact disc. Selling music required a lot of capital-thousands of stores around the country, delivery trucks, and cash registers.
It also required a lot of labor, including store clerks, security guards, and truck drivers. Today, you can purchase and download your music over the Internet.
This leaves more resources for the production of other things. We can use the production possibilities frontier model to show the effects of economic growth. Start by looking at the left panel of Figure 2.5. The horizontal axis indicates the quantity of food produced in a country. The vertical axis indicates the quantity of “all other goods,” meaning all goods and services other than food, produced in the country.
These general categories of goods are useful when discussing aspects of the entire economy rather than the tradeoff between two specific goods. It is relatively hard to pin down what a unit of “food” or a unit of “all other goods” is, but think of these units as bundles of all types of food and all types of other goods and services.
Suppose the country initially chooses point X. Are the citizens content with what they have? No— wants are unlimited! They want more of everything from pizza and electric cars to health care and education. This motivates the development of resource-saving production methods and investment in new capital.
Over time, this results in economic growth, which shifts the entire production possibilities frontier outward. The right panel of Figure 2.5 shows the original production possibilities frontier and the new one. Thanks to economic growth, the country can produce more food, more of all other goods, or more food and more of all other goods. The last option— more of both— is shown by the movement from point X on the original production possibilities frontier to point Y on the new production possibilities frontier.
Economic growth is a common goal because it enables a country to produce more goods and services and do a better job satisfying the needs and wants of its citizens. When the economy grows, the country can produce more of everything.
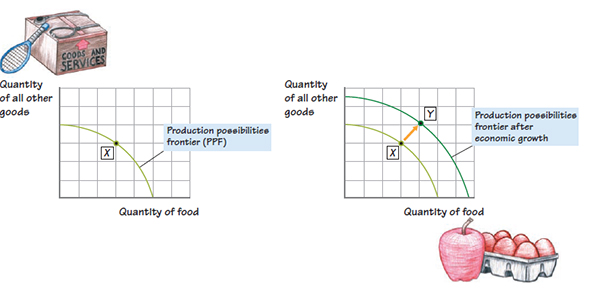
Figure 2.5 Economic Growth and the PPF
Economic growth shifts the entire production possibilities frontier outward, allowing a country to produce more of any or all goods
However, there are opportunity costs connected with economic growth. For a country to enjoy the benefits of economic growth in the future, it must make economic sacrifices in the present. It must take resources that could be used to make goods for consumption now and instead use them to make capital and develop improved production methods for the future. It’s like when you forgo purchases of things you would enjoy now in order to save money for college and other ways to improve your life later on.