The Law of Supply and the Supply Curve
- Detalii
- Categorie: Economics
- Accesări: 56,375
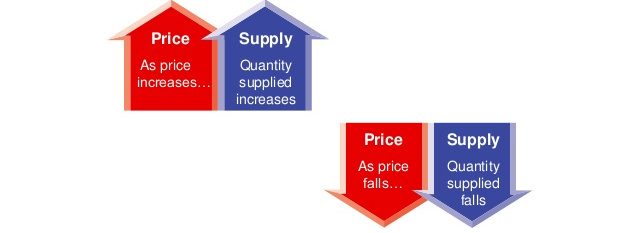
The Law of Supply is a fundamental principle in economics that states:
- As the price of a good or service increases, the quantity supplied also increases.
- As the price decreases, the quantity supplied decreases.
This happens because higher prices make production more profitable, encouraging businesses to produce and sell more. Conversely, when prices drop, suppliers may reduce production because it becomes less profitable.
What Is the Law of Supply?
The Law of Supply is a fundamental economic principle stating that as the price of a good or service increases, the quantity supplied also increases —and vice versa, assuming all other factors remain constant ( ceteris paribus ).
This principle explains why businesses produce more when prices rise, as higher prices lead to higher potential profits. Conversely, when prices fall, businesses are less willing to produce and sell the product.
Key Concepts of the Law of Supply
1. Direct Relationship Between Price and Supply
The law of supply highlights a positive correlation between price and quantity supplied:
- Higher prices → Increased supply (Businesses produce more to maximize profits).
- Lower prices → Decreased supply (Businesses reduce production due to lower profitability).
2. Ceteris Paribus (All Else Being Equal)
The law assumes that other factors influencing supply (technology, production costs, market conditions, etc.) remain constant . If these factors change, they can shift supply curves rather than simply moving along the curve.
3. Supply Curve Representation
Graphically, the supply curve slopes upward from left to right, reflecting the direct relationship between price and quantity supplied.
As you’ve learned, consumers demand products and services at the lowest possible prices. In contrast, suppliers like Microsoft exist to make a profit—hopefully, a big profit. As you read this section, you’ll learn about the law of supply and how it is geared toward making profits.
Profits and the Law of Supply
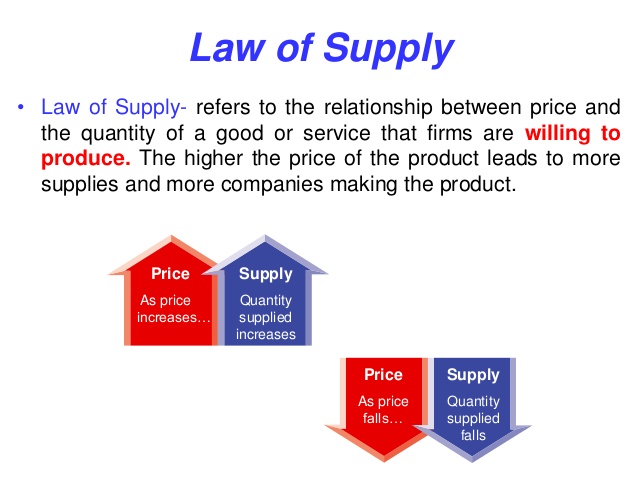
The law of supply states that as price goes up, quantity supplied goes up, and vice versa.
Economics & You Would you be willing to work more hours at your job for the same wages? Read on to learn that businesses are only willing to supply more of something if their profits also increase. To understand how prices are determined, you have to look at both demand and supply —the willingness and ability of producers to provide goods and services at different prices in the marketplace. The law of supply states that as the price of good rises, the quantity supplied generally rises; as the price falls, the quantity supplied also falls. (See Figure 7.6 below.)
You may recall that with demand, price and quantity demanded move in opposite directions. With supply, a direct relationship exists between the price and quantity supplied . A direct relationship means that when prices rise, the quantity supplied will rise, too. When prices fall, the quantity supplied by sellers will also fall. Thus, a larger quantity will generally be supplied at higher prices than at lower prices. A smaller quantity will generally be supplied at lower prices than at higher prices.
The profit incentive is one of the factors that motivate people in a market economy . In the case of supply, the higher the price of a good, the greater the incentive is for a producer to produce more. The higher price not only returns higher revenues from sales but also covers the additional costs of producing more. This concept is the basis of the law of supply .
The Supply Curve
A supply curve is a graph that shows the relationship between price and quantity supplied .
Economics & You How many extra hours would you be willing to work for $1? For $100? Read on to learn how the relationship between price and quantity supplied can be illustrated with a supply curve .
Remember that economists show the relationship between price and quantity demanded by using a demand schedule and a demand curve. Similarly, we can use special tables and graphs to illustrate the law of supply visually. (See Figure 7.7 below.)
Using the example of DVD producers, the graphs in this figure show a visual relationship between the price of each DVD and the quantity of DVDs that producers are willing to supply at each price.
Table A in Figure 7.7 is the supply schedule , which is a table showing that as the price per DVD increases, the quantity that producers are willing to supply also increases. For example, at a price of $10 per DVD, only 100 million DVDs will be supplied. When the price increases to $15 each, however, 600 million DVDs will be supplied.
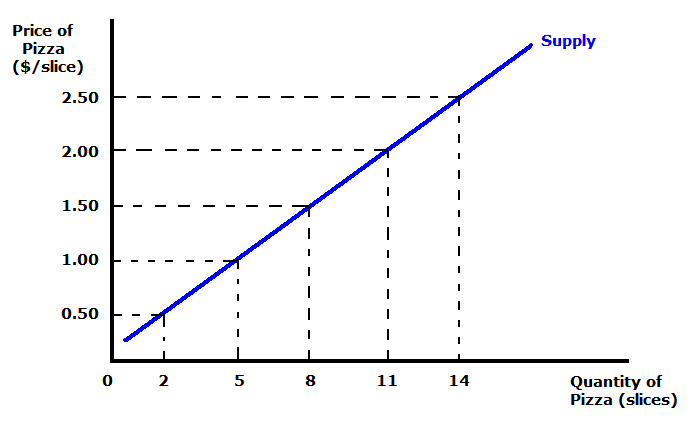
Note how each of the two graphs uses a different format to show the same thing. Each shows the law of supply—as price rises, quantity supplied increases.
Table A. Supply Schedule
The numbers in this supply schedule show that as the price per DVD increases, the quantity supplied increases. At $16 each, a quantity of 700 million DVDs will be supplied
Graph B. Supply Curve
Here the price and quantity supplied figures from the supply schedule have been plotted on a graph and connected with a line. This line is the supply curve , which rises from left to right.
The Determinants of Supply
A change in the supply of a particular item shifts the entire supply curve to the left or right .
Economics & You Why are iPods so much more common now than they were five years ago? Read on to learn about the factors that affect supply.
Many factors can affect the supply of a specific product. Four of the major determinants of supply (not quantity supplied) are the price of inputs, the number of firms in the industry, taxes, and technology.
Factors That Affect Supply Beyond Price
While price is the main driver in the law of supply , other factors can influence supply levels:
- Production Costs – Higher costs (e.g., wages, raw materials) can reduce supply even if prices rise.
- Technology – Advances in production methods can increase supply by reducing costs.
- Government Policies – Taxes, subsidies, and regulations can either encourage or restrict supply.
- Natural Disasters & Weather – Climate conditions affect industries like agriculture, reducing supply in cases of drought or storms.
- Number of Suppliers – More businesses entering the market increases overall supply.
Production Costs
If the price of the inputs needed to make a product—raw materials, wages, and so on—drops, a producer can supply more at a lower production cost. This causes the entire supply curve to shift to the right. This situation occurred, for example, when the price of memory chips used in making computers fell during the 1980s and 1990s. Look at the graph on the left. Line S1 shows the supply of computers before the price of memory chips fell. Line S2 shows the increased supply of computers after the price of memory chips fell. After the price drop, more computers were supplied at any given price than before.
In contrast, if the cost of inputs increases, then the cost of production also increases, and suppliers will offer fewer goods for sale at every possible price.
Number of Firms in the Industry
As more firms enter an industry, greater quantities of their product or service are supplied at every price, and the supply curve shifts to the right. The larger the number of suppliers, the greater the market supply. Consider DVD rentals, for example. If profits from movie and game rentals increase, the number of DVD rental stores supplying these items will increase as well. As more DVD rental stores enter the market, the supply curve for DVD rentals shifts to the right. This shift is shown in the graph on the left.
Conversely, if some suppliers leave the market, fewer quantities of their product or service are supplied at every price, and the supply curve shifts to the left. Sellers in a free-market economy are entering and leaving the market all the time.
Taxes and Government Policies
If the government imposes more taxes on the production of certain items, businesses will not be willing to supply as much as before because the cost of production will rise. The supply curve for products will shift to the left, indicating a decrease in supply. For example, if taxes on the production of silk scarves increased, businesses that sell silk scarves would supply fewer quantities at each and every price.
Look at the graph on the right. Line S1 indicates the supply of silk scarves before the government raised taxes on this product. Line S2 equals the supply after the government raised taxes. Because of the increased cost of production caused by the taxes, the entire supply curve for silk scarves shifted to the left.
Technology
The use of science to develop new products and new methods for producing and distributing goods and services is called technology .
Any improvement in technology will increase supply, as shown in the graph on the right. This is because new technology usually allows suppliers to make more goods for a lower cost. The entire cost of production is cut, and the supply curve shifts to the right.
Advances in Technology
In the early 1900s, improved technology in the auto-making industry greatly reduced the amount of time and other resources needed to make many new automobiles. Therefore, a larger quantity supplied of autos was offered for sale at every price.
The Law of Diminishing Returns
When a business wants to expand, i t has to consider how much expansion will really help the business .
Economics & You Have you ever heard the expression, “Too many cooks spoil the soup”? Read on to learn why hiring more workers is not always the best option for businesses.
Imagine that you own a business, and you want to expand production. Assume you have 10 machines and employ 10 workers, and you hire an 11th worker. Now, production increased by 1,000 units per week. When you hire a 12th worker, however, production increases by only 900 per week.
If you continue to hire more workers, production will continue to increase, but the rate of increase will fall. Maybe there are not enough machines to go around, and perhaps the workers are getting in each other’s way. If you continue to hire still more workers, your overall output will eventually decrease.
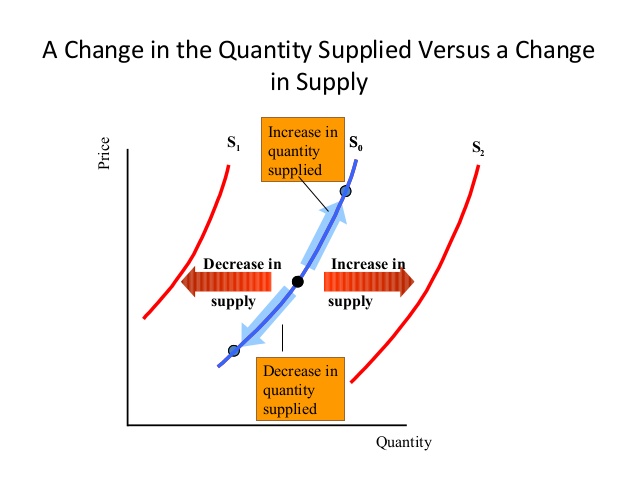
Remember that there is a difference between a change in supply and a change in quantity supplied.
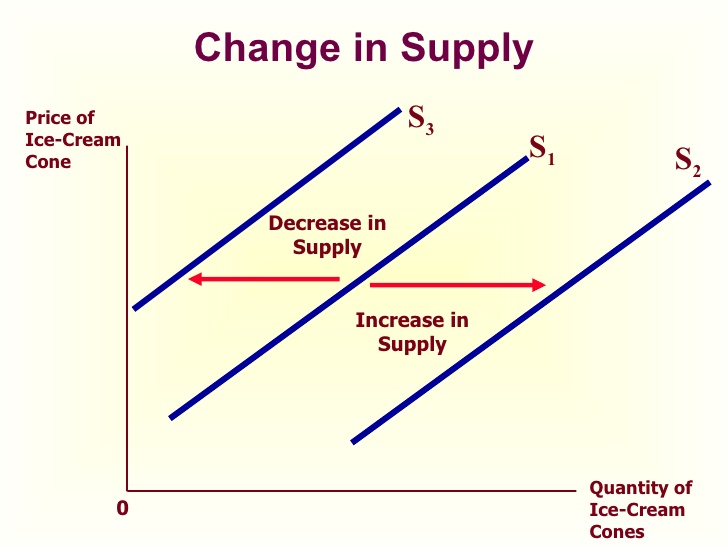
This is caused by something other than price, and it causes the entire supply curve to shift to the left or right.
Graph B. Change in Quantity Supplied
This is caused by a change in the price of a good, and it is shown as a movement along the supply curve.
This example illustrates the law of diminishing returns , which says that adding units of one factor of production increases total output. After a certain point, however, the extra output for each additional unit hired will begin to decrease.
Content Vocabulary
- law of supply: economic rule stating that price and quantity supplied move in the same direction
- quantity supplied: the amount of a good or service that a producer is willing and able to supply at a specific price
- supply schedule: table showing quantities supplied at different possible prices
- supply curve: upward-sloping line that shows in graph form the quantities supplied at each possible price
- technology: the use of science to develop new products and new methods for producing and distributing goods and services
- law of diminishing returns: economic rule that says as more units of a factor of production are added to other factors of production, after some point total output continues to increase but at a diminishing rate
Putting Supply and Demand Together
What do Beanie Babies, Cabbage Patch Kids, and iPods all have in common? At one point in time, they all were in short supply—and usually right before the December holiday season. Around that time of year, you can often see empty shelves in stores where the hot items have sold out. As you will read, shortages occur when the quantity demanded is larger than the quantity supplied at the current price.
Equilibrium Price
In free markets, prices are determined by the interaction of supply and demand .
Economics & You When new video game systems first come out, they are often too expensive for most people to buy. What happens to the price of the systems over time? Read on to learn about equilibrium price , the point at which demand and supply meet.
In the real world, demand and supply operate together. As the price of a good goes down, the quantity demanded rises and the quantity supplied falls. As the price goes up, the quantity demanded falls and the quantity supplied rises.
Is there a price at which the quantity demanded and the quantity supplied meet? Yes. This level is called the equilibrium price . At this price, the quantity supplied by sellers is the same as the quantity demanded by buyers. One way to visualize equilibrium prices is to put the supply and demand curves on one graph, as shown in Figure 7.10. Where the two curves intersect is the equilibrium price.
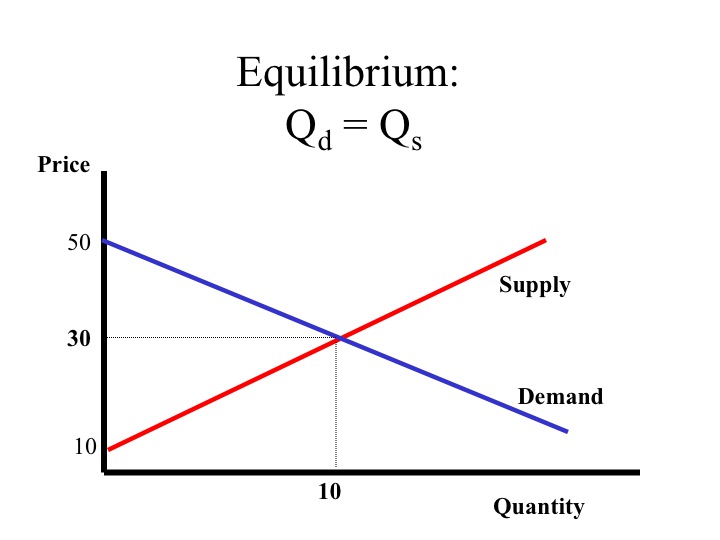
How does the market reach an equilibrium price ? Study the charts. If sellers think the price for DVDs will be $20, they will produce 1,100 million units, but buyers will purchase only 100 million. To get rid of the surplus, suppose sellers lower the price to $10 and are willing to supply 100 million DVDs. At this price, 100 million are supplied but 1,100 million are demanded, leaving a shortage. The price tends to change until it reaches equilibrium.
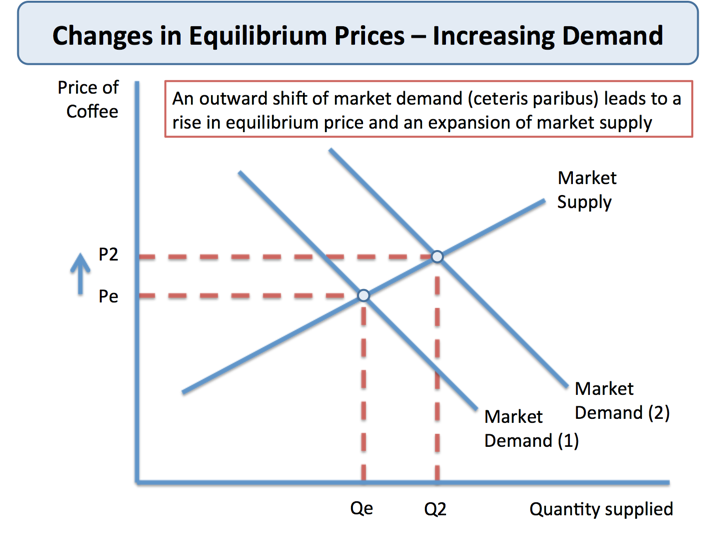
When the supply or demand curves shift, the equilibrium price also changes. Note that the old equilibrium price was $15. But now the new demand curve intersects the supply curve at a higher price—$17.
What happens when there is an increase in the demand for DVDs? Assume that scientists prove that watching a lot of movies increases life span. This discovery will cause the entire demand curve to shift outward to the right, as shown in Figure 7.11 above.
What about changes in supply? You can show these in a similar fashion. Assume that there is a major breakthrough in the technology of producing DVDs. The supply curve shifts outward to the right. The new equilibrium price will fall, and both the quantity supplied and the quantity demanded will increase.
Prices as Signals
Under a free-enterprise system , prices function as signals that communicate information and coordinate the activities of producers and consumers.
Economics & You Can you think of a recent event that affected the price of an everyday item such as gasoline? Read on to learn about shortages, surpluses, and their effect on prices.
In the United States and other countries with mainly free enterprise systems, prices serve as signals to producers and consumers. Rising prices signal producers to produce more and consumers to purchase less. Falling prices signal producers to produce less and consumers to purchase more.
Shortages
A shortage occurs when, at the current price, the quantity demanded is greater than the quantity supplied. If the market is left alone—without government regulations or other restrictions—shortages put pressure on prices to rise. At a higher price, consumers reduce their purchases, whereas suppliers increase the quantity they supply.
Surpluses
At prices above the equilibrium price, suppliers produce more than consumers want to purchase in the marketplace. Suppliers end up with surpluses —large, undesired inventories of goods—and this and other forces put pressure on the price to drop to the equilibrium price .
If the price falls, suppliers have less incentive to supply as much as before, whereas consumers begin to purchase a greater quantity. The decrease in price toward the equilibrium price , therefore, eliminates the surplus.
Market Forces
One of the benefits of the market economy is that when it operates without restriction, it eliminates shortages and surpluses. Whenever shortages occur, the market ends up taking care of itself—the price goes up to eliminate the shortage. Whenever surpluses occur, the market again ends up taking care of itself—the price falls to eliminate the surplus. Now, let’s take a look at what happens to the availability of goods and services when the government— not market forces—becomes involved in setting prices.
Price Controls
Under certain circumstances, the government sometimes sets a limit on how high or low a price of a good or service can go .
Economics & You Do you think there are times when the government is justified in setting prices on certain goods and services? Read on to learn why this sometimes happens.
The government sometimes gets involved in setting prices if it believes such measures are needed to protect consumers or suppliers. Also, special interest groups sometimes exert pressure on elected officials to protect certain industries.
Price Ceilings
A price ceiling is a government-set maximum price that can be charged for goods and services. For example, city officials might set a price ceiling on what landlords can charge for rent. As Graph A of Figure 7.13 below shows, when a price ceiling is set below the equilibrium price , a shortage occurs.
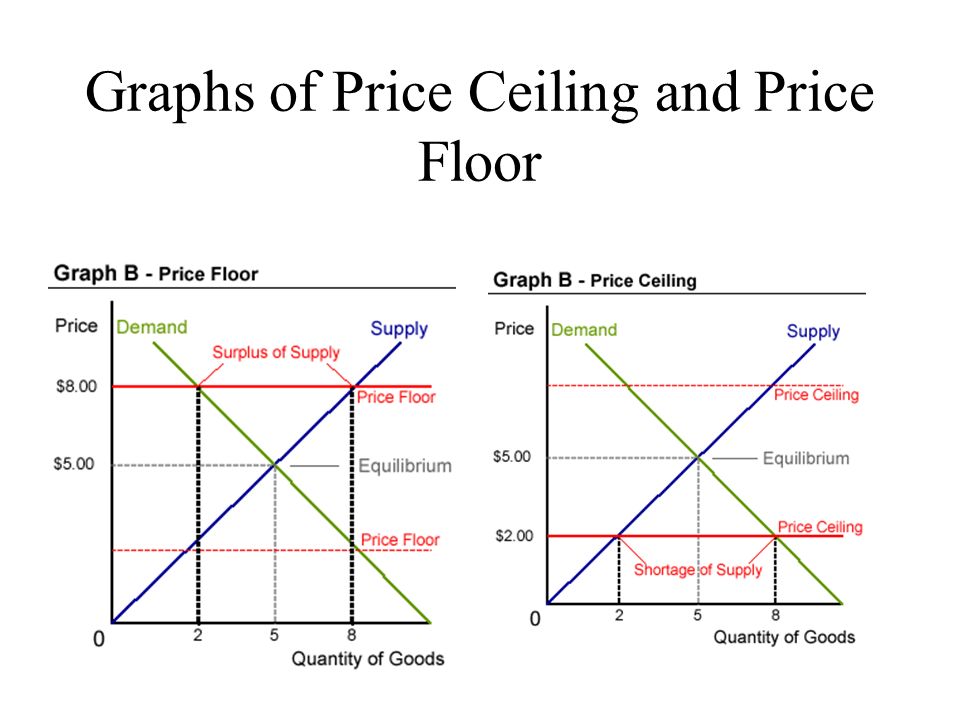
When the government gets involved in setting prices, price ceilings or price floors may result.
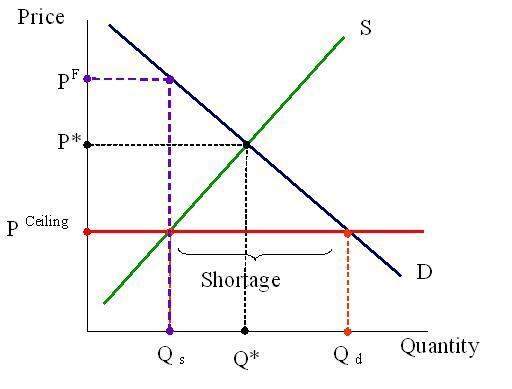
More people would like to rent at the government-controlled price, but apartment owners are unwilling to build more rental units if they cannot charge higher rent. This results in a shortage of apartments to rent.
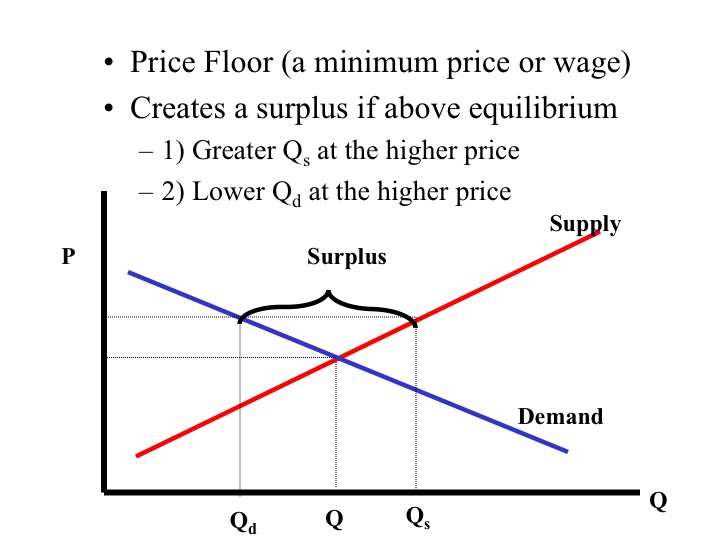
A fast-food restaurant wants to hire students at $4.15 an hour, but the government has set a minimum wage—a price floor—of $5.15 an hour.
Black Market
Scalpers selling high-priced, limited tickets are part of the black market.
Effective price ceilings—and resulting shortages—often lead to nonmarket ways of distributing goods and services. The government may resort to rationing , or limiting, items that are in short supply. Shortages also may lead to a black market , in which illegally high prices are charged for items that are in short supply.
Price Floors
A price floor , in contrast, is a government-set minimum price that can be charged for goods and services. Price floors—more common than price ceilings—prevent prices from dropping too low. When are low prices a problem? Assume that about 30 of your classmates all want jobs after school. The local fast-food restaurant can hire 30 students at $4.15 an hour, but the government has set a minimum wage—a price floor—of $5.15 an hour. At that wage, not all of you will get hired, which will lead to a surplus of unemployed workers as shown in Graph B of Figure 7.13. If the market was left on its own, you and all of your classmates would be working at the equilibrium price of $4.15 per hour.
Content Vocabulary
- equilibrium price: the price at which the amount producers are willing to supply is equal to the amount consumers are willing to buy
- shortage: situation in which the quantity demanded is greater than the quantity supplied at the current price
- surplus: the situation in which the quantity supplied is greater than the quantity demanded at the current price
- price ceiling: a legal maximum price that may be charged for a particular good or service
- rationing: the distribution of goods and services based on something other than price
- black market: “underground” or illegal market in which goods are traded at prices above their legal maximum prices or in which illegal goods are sold
- price floor: a legal minimum price below which a good or service may not be sold
Conclusion: Why Is the Law of Supply Important?
The Law of Supply is essential for businesses, policymakers, and consumers as it helps:
- Predict market behavior based on price changes.
- Guide businesses in adjusting production levels.
- Influence government policies on taxation, subsidies, and price controls.
Understanding this principle helps both companies and consumers make informed financial decisions. Whether you're a business owner setting prices or a consumer reacting to price fluctuations, the Law of Supply is always at play in the economy!
FAQ: Understanding the Law of Supply
1. What is the Law of Supply in simple terms?
The Law of Supply states that as the price of a good or service increases, the quantity that suppliers are willing to offer also increases. Conversely, when prices drop, suppliers produce and sell less, assuming all other factors remain constant (ceteris paribus).
2. Why does the supply curve slope upward?
The supply curve slopes upward because there is a direct relationship between price and quantity supplied. Higher prices incentivize producers to increase output to maximize profits, while lower prices discourage production.
3. What factors can cause a shift in the supply curve?
Factors such as changes in production costs, advancements in technology, the number of suppliers, government policies (like taxes and subsidies), and natural events can shift the entire supply curve to the left or right, indicating an increase or decrease in supply at all price levels.
4. How do price ceilings and price floors affect the Law of Supply?
Price ceilings (maximum legal prices) can cause shortages by setting prices below equilibrium, reducing supplier incentives. Price floors (minimum legal prices) can create surpluses by setting prices above equilibrium, encouraging overproduction.
5. Why is understanding the Law of Supply important for businesses and consumers?
Understanding the Law of Supply helps businesses set optimal prices and plan production, while helping consumers anticipate price changes. It also informs policymakers when designing economic regulations such as taxes, subsidies, and price controls.