Gross domestic product
- Details
- Category: Macroeconomics
- Hits: 8,849
Perhaps the most important concept in macroeconomics is Gross Domestic Product (GDP): Gross Domestic Product (GDP) is defined as the market value of all finished goods and services produced in a country during a certain period of time.
Note that we only include finished goods and services – that is, anything that is sold directly to the consumer. Electric power sold to a steel mill is not included while all the electric power sold directly to consumers is included. The reason is simply that we want to avoid “double counting”. Consider for example the production of cars.
Car producers have parts produced by other firms which in turn have parts delivered by other firms and so on. If we were to count the value of everything produced by a firm, then most parts of a car would be counted several times. This is why only the value of the finished car is used in the calculation of GDP.
Note, however, that if a firm buys a robot that it uses in the production of cars, then this robot is counted (if it is produced in the same country). The car producer is then the “final consumer” of the robot – no value is added to it and it is not resold to another firm.
Real GDP
To be able to make reasonable comparisons of GDP over time, we must adjust for inflation. For example, if prices are doubled over one year, then GDP will double even though exactly the same goods and services are produced as the year before. To eliminate the effect of inflation we divide GDP by a price index and we define real GDP as GDP divided by a price index.
It is not very common to use Consumer Price Index (CPI) in the construction of real GDP. The reason is that CPI measures the price evolution of consumer goods while GDP includes investment goods as well as consumer goods. Instead, it is common to use a GDP deflator as a price index. The GDP deflator measures the price evolution of a basket whose composition is close to the composition of GDP. The difference between the CPI and the GDP deflator is fairly small however. To avoid confusion, GDP that is not adjusted for inflation is often called nominal GDP.
Growth
By (nominal) GDP-growth we mean the percentage change in (nominal) GDP over a specific period of time. Real GDP growth is defined as the percentage change in real GDP. The real growth tells us how much the economy has grown during a particular period when the effect of inflation is removed.
Purchasing power
One problem in using the exchange rate when comparing GDP per capita between countries is that is fluctuates quite a lot. A way of avoiding dependence on the exchange rate is to use purchasing power.
GDP is a flow!
Finally, note that GDP is a flow variable and not a stock variable. By a flow variable, we mean a variable that is measured in something per unit of time. If you fill a bathtub you may fill it at 40 liters per minute – a flow – while the tub itself may contain 200 liters – a stock. In the same way, income is flow (you may make 9 euro per hour) while the amount of money you have in your bank account is a stock (you would never claim that you have 2400 euro “per month” in your account – you have 2400 euro period).
GDP, being a flow, is not a measure of the total wealth of a country but a measure of the “income” of the country during a certain period of time. Sure, if GDP is high, it is quite likely that the total wealth of the country is increasing over time (some wealth is lost to depreciation). Therefore, there is often a connection between what we perceive as a “rich” country and a high GDP per capita.
The components of GDP
The circular flow – simple version
We have defined GDP, the gross domestic product, as the market value of all finished goods and service produced in a country during a specific period of time. We will now look closer at the definition and the components of GDP – something which is necessary if we want to understand macroeconomics. In order to better figure out the details of GDP we will use the “circular flow model”.
The main purpose of the circular flow is to show how goods, services and money flow to and from various sectors in the economy. Such a model may be more or less detailed. We will start with the least detailed version and then construct a more complete model to which we will refer throughout the book.
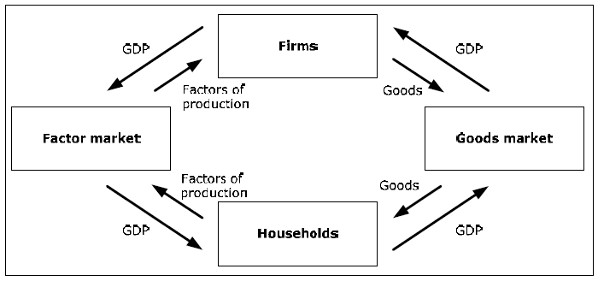
Fig 4.1
In this model goods (and services) flow counter-clockwise while money flows clockwise.
- Firms deliver finished goods to the goods market (semi-manufactured goods circulate within the box firms). Firms are compensated for the goods and this compensation is equal to GDP.
- Consumers receive goods from the goods market where prices are determined through supply and demand.
- In order to pay for the goods, the consumers deliver factors of production (labor and capital) to the factor markets.
- Firms buy factors of production using the income they receive from the goods market.
Note that the flow of money from firms to the factor markets is exactly the same as the flow of money from the goods market to the firms. If this was not the case, firms as a group would make a profit or a loss. But since all firms are owned by individuals (directly or indirectly through pension funds and other funds), all profits or losses must eventually fall on the consumers. This flow is part of the return on capital, a flow of money to the factor market.
The circular flow – a more detailed version
We need a more detailed version of the circular flow model in order to understand important issues in macroeconomics. However, even the more detailed version must be a simplified model of the real
world. We will only include details that are important for the understanding of macroeconomics at this level. All the details and the exact definitions would use up too much space.
To make the figure less complicated, we start with the firms. Then we draw the circular flow using two parts. In the first part we illustrate how goods flow between various sectors of the economy, while in the second part we show how money flows.
Modeling a firm and the concept value-added
Before we look at the more detailed version of the circular flow, we will illustrate the model of the firm that we will use in this book.
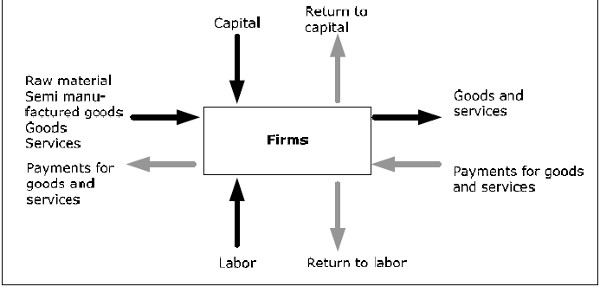
Fig. 4.2: Firms in the circular flow.
A firm in our model is a unit which adds value to products. These products may be raw material, semi-manufactured goods, final goods and services. By adding value, we mean that the firm acquires the good, adds value to it and then sells it. A supermarket adds value to a final good by making it more available to consumers and a bakery adds value to flour when it bakes bread.
Firms add value by using factors of production (mostly various forms of labor and capital). We define value-added as the difference between the revenue and the cost of the goods. If a supermarket buys a fish for 4 euro and sells it for 5 euro, it has added 1 euro of value to the fish.
From the diagram we see that the value-added in a firm must be equal to the compensation to the factors of production. This must be the case since the net flow of money for a firm must be zero (remember that profits become to return to capital – compensation to the owners of the firm).
Firms in the circular flow
We divide all firms into three categories: FR consists of all firms that acquire raw material (iron ore, farm products and so on), FH all those that produce semi-manufactured goods (steel, pulp and so on) and FF all firms producing finished goods (software, cars and so on). We use the symbol Y for GDP. All of Y will go to the firms in the FF box. However, if we sum the value-added from all firms, we will get exactly Y. This is why:
Fig. 4.3: Goods in the circular flow.
- If YR is the total value of all goods going from FR to FH, then the total value added from all firms in the FR box is equal to YR (they do not purchase any goods to which they add value).
- In the same way, if the total value of all goods going from FH to FF is given by YH, then the total value added from all firms in the FH box is YH – YR.
- In the same way, the total value added for all firms in the FF box will be equal to Y – YH. If we sum all the value-added from all firms, we get YR + (YH – YR) + (Y – YH) = Y.
- This result is independent of how many “levels” or boxes we have in the production process. Instead of three levels, we could have any number of levels and the result would still hold. Also, a particular firm may be produced in several of the boxes.
Since the value-added in each firm is equal to the return to the factors of production, the total return to the factor market must be equal to the sum of value added from all firms, which is equal to Y.
The total return to the factor market = Sum of all value-added = GDP
Circular flow – circulation of goods
Figure 4.4 shows a more developed version of the circular flow. In this figure we see how goods flow through the various sectors of the economy.

Fig. 4.4: Money in the circular flow.
- In addition to the private sector, we now include the Government and the Rest of the World in this model.
- Finished goods in the goods market are divided into four categories: private consumption going to the private sector, public consumption for the government (health care, education, defense and so on), investment going to firms and export to the rest of the world. To this flow must now add imports from the rest of the world.
Circular flow – circulation of money
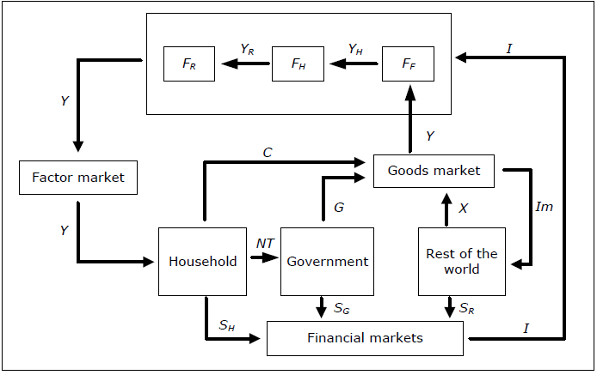
Fig. 4.5 Circular flow – circulation of money
The private sector in the circular flow:
- The private sector's total income is called national income. Since the private sector receives the entire return from the factors of production, the national income is equal to the GDP and we can use the symbol Y for national income as well. Note that in a more detailed analysis of the components of GDP, including for example depreciation and factor income from abroad, it is no longer the case that national income is exactly the same as GDP, but they will often be close to each other.
- The private sector pays taxes to the government. Here we must include all taxes, income taxes, value-added taxes, selective purchase taxes and payroll taxes (which are ultimately paid by the private sector since it owns the firms).
- Part of these taxes will be returned to the private sector in the form of pensions, child allowances, sickness benefits, unemployment benefits and so on. All these are examples of transfers from the government.
- Net tax is then defined as taxes minus transfers and is denoted by NT.
- National income minus net tax is called disposable income or personal disposable income and is denoted by YDisp where YDisp = Y – NT.
- Total consumption by the private sector is denoted by C. C need not be equal to disposable income as the private sector can save and borrow. We define the private sector's savings as SH = YDisp – C ( H for the household). If C > YDisp then SH < 0, which implies that the private sector (in the aggregate) is borrowing money.
The Government, Rest of the World and the financial markets
The total expenditure of the government may be divided into two parts: transfers to the private sector and consumption.
Government expenditure is the total expenditure by the government on goods and services. Note that the salary paid to an officer in the army is included in the government expenditure while the pension to the same officer is part of the transfers. We denote government expenditure by G.
Government revenue is from taxes paid by the private sector. Since part of the taxes is returned through transfers, the government has NT available for consumption.
We say that the government has a balanced budget if G = NT. We also define government savings as SG = NT – G.
The total value of all exports to the rest of the world is denoted by X, while the total value of all imports from the rest of the world is denoted by Im. If Im > X then the value of all goods and services received from the rest of the world is larger than the value of goods and services that we send to them. The difference, SR = Im – X is the rest of the world savings and this is also the amount we borrow from the rest of the world, which must eventually be paid back by exporting more than we import.
Firms borrow money from the financial markets in order to finance investments, denoted by I. Investments are financed by private sector savings, government savings and rest of the world savings, I = SH + SG + SR. Note that SH , SG and/or SR may be negative.
Components of GDP
By considering all arrows to and from the goods market we see that
Y + Im = C + I + G + X
The left-hand side is the value of all finished goods flowing into the goods market and the right-hand side decomposes all goods into four categories. Note that this is simply an accounting identity and it must always hold.
Moving Im to the right-hand side we have
Y = C + I + G + X – Im
X – Im is called net exports, NX and NX = – SR.
Note that net exports is equal to the amount that the rest of the world borrows from our country. Thus, we can write Y = C + I + G + NX where C, I, G, NX are called the components of GDP.
We have another accounting identity from the financial markets:
SH + SG + SR = I
Using SH = YDisp –C = Y – NT – C, SG = NT – G and SR = Im – X we get Y – NT – C + NT – G + Im –X = I which is equivalent to the accounting identity from the goods market. Thus, if the accounting identity from the financial markets holds, the identity from the goods market must hold and vice versa. But the most important relationship to remember is
Y = C + I + G + NX
Four different measures of GDP
Using the circular flow model we see that there are four equivalent ways of measuring GDP:
- Using the definition: the market value of all finished goods (expenditure method)
- As the sum of all value added from all firms (value-added method)
- As the sum of consumption (private and government), investment and net exports(components method)
- As the sum of all returns from the factor markets: wages, return on capital and so on(income method)
Capital
By capital, we typically mean manufactured goods that are used to produce other goods and services but are not used up in the production process (such as machines and computers). Sometimes we use the term fixed capital instead of capital to distinguish capital from financial capital, which consists of bank deposits, stocks, bonds and other assets. Fixed capital is sometimes divided into physical capital and immaterial capital such as individual capital (talent, skills, knowledge) and social capital.
Investment
When we use the word investment, we typically mean gross investment. Basically, gross investment consists of all finished goods that we have produced but not consumed. The important parts of gross investment are a gross fixed investment and changes in inventories.
Gross fixed investment is the total amount of investment in fixed capital. If a firm produces more than it sells in a particular period of time, its inventory will increase. This will be counted as a positive investment.
In the same way, we will have a negative inventory investment whenever inventories decrease.
By net investments, we mean gross investments minus depreciation such that the actual increase in the amount of capital between two periods in time is equal to the net investment during this period. Keep in mind that while capital is a stock, investment is a flow. We may talk about a firm’s total amount of capital at a particular point in time and a firm’s total investment over a period of time.
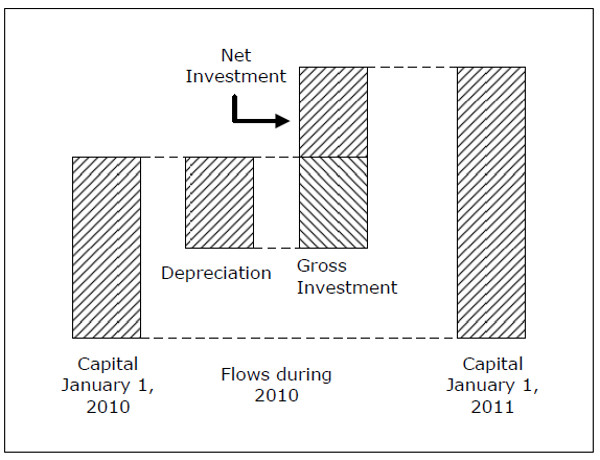
Fig. 4.6
Components of GDP in numbers 200x
BNP Y 2 673
Privat konsumtion C 1 283
Investeringar I 456
Offentlig konsumtion G 728
Import Im 1 093
Export X 1 299
Nettoexport NX 206
C + I + G + NX 2 673