Demand, The Demand Curve and Elasticity of Demand
- Details
- Category: Economics
- Hits: 31,708
The word demand has a special meaning in economics. Most American teenagers own a pair of sneakers. Because of high demand and high price, however, not everyone who wants a pair of Nike Air Force 1 sneakers is able to acquire this particular brand. As you read this section, you’ll learn that the idea of demand centers on people being both willing and able to pay for a product or service.
The Marketplace
In a market economy, buyers and sellers set prices.
Economics & You Have you ever sold something on eBay? How did you decide what price to set? Read on to learn how people like eBay users follow basic ideas of demand and supply.
When you buy something, do you ever wonder why it sells at the particular price you paid? People do not usually think that individual consumers have any influence over the price of an item. In the Market Economy, however, consumers collectively have a great deal of influence on the prices of all goods and services. To understand this, let’s look first at how people in the marketplace decide what to buy and at what price. This is demand. Later, we’ll examine how the people who want to sell goods and services decide how much to sell and at what price. This is supply.
What is the marketplace? A market represents the freely chosen actions between buyers and sellers of goods and services. A market for a particular item or service can be local, national, international, or a combination of these.
When you hear the term “market” you probably think of a supermarket, clothing store, record shop, or other store you have visited. However, a “market” can be any place where buyers and sellers come together.
- Stores Any place where you can buy food, clothing, or other items is a market.
- Services A service is any activity that one person performs for another for a fee.
Examples of services include haircutting, tutoring, and dental checkups. Any time or place these services are performed is an example of a market.
In a market economy, individuals decide for themselves the answers to the WHAT?, HOW?, and FOR WHOM? Economic questions that you studied back in Economic Systems and Characteristics of the American Economy.
The basis of activity in a market economy is the principle of voluntary exchange. A buyer and a seller exercise their economic freedom by working toward satisfactory terms of an exchange of goods or services. For example, the seller of an automobile sets a certain price based on his or her view of market conditions. The buyer, through the act of buying, agrees to the product and the price. In order to make the exchange, both the buyer and the seller must believe they will be better off—richer or happier—after the exchange than before.
In a market economy, buyers have many choices about how to spend their income, and sellers have many choices about how to sell their products. With voluntary exchange, the seller’s problem of what to charge and the buyer’s problem of how much to pay is solved voluntarily in the market. Supply and demand analysis is a model of how buyers and sellers operate in the marketplace. Such analysis is a way of explaining cause and effect in relation to price.
The Law of Demand
The law of demand states that as price goes up, quantity demanded goes down, and vice versa.
Economics & You Can you think of a common household item that was once very expensive but is now much cheaper? Read on to find out how demand affects the prices of items you buy and use every day.
Demand, in economic terms, represents all of the different quantities of a good or service that consumers will purchase at various prices. It includes both the willingness and the ability to pay. A person may say he or she wants a new DVD. Until that person is both willing and able to buy it, however, no demand for DVDs has been created by that individual.
The law of demand explains how people react to changing prices in terms of the quantities demanded of a good or service. (See Figure 7.2.) There is an inverse, or opposite, relationship between quantity demanded and price. For example, if the price of a DVD is $15 many people will buy it. If the price went up to $20 fewer people would buy it, but many people who wanted the DVD would still buy it. Only a few people would buy the DVD if the price went up to $75. This example shows how the law of demand works.
Several factors explain the inverse relation between price and quantity demanded, or how much people will buy of any item at a particular price. These factors include real income, possible substitutes, and diminishing marginal utility.

Figure 7.2 The Law of Demand
Real Income Effect
No one—not even the wealthiest person in the world—will ever be able to buy everything he or she might possibly want. People’s incomes limit the amount they are able to spend. Individuals cannot keep buying the same quantity of a good if its price rises while their income stays the same. This concept is known as the real income effect on demand. It forces consumers to make trade-offs.
Suppose that you normally fill your car’s gas tank twice a month, spending $40 each time. If the price of gasoline rises, you may have to spend $50 each time. If the price continues to rise while your income does not, eventually you will not be able to fill the gas tank twice per month because your real income, or purchasing power, has dropped. To keep buying the same amount of gasoline, you would need to cut back on buying other things. The real income effect forces you to make a trade-off in your gasoline purchases. The same is true for every item you buy, particularly those you buy regularly.
The real income effect works in the opposite direction, too. If you are already buying $80 worth of gas each month, and the price of gas drops dramatically, your real income increases. You will have more purchasing power and will be able to spend the extra amount you save on gas on other things you want to buy.
Real Income Effect
If the price of gasoline rises but your income does not, you obviously cannot continue buying the same amount of gasoline and everything else you normally purchase.
Substitution Effect
Suppose there are two items that are not exactly the same but which satisfy basically the same need. Their cost is about the same. If the price of one falls, people will most likely buy it instead of the other, now higher-priced, good. If the price of one rises in relation to the price of the other, people will buy the now lower-priced good. This principle is called the substitution effect.
Suppose, for example, that you listen to both CDs and downloaded music. If the price of CDs rises dramatically, you will probably buy more music downloads and fewer CDs.
Alternately, if the price of music downloads increases, you will probably buy more CDs. If the prices of CDs and music downloads both increase, you will most likely buy fewer of each and look for other ways to listen to music—for example, you may start listening to the radio or borrowing CDs from the library.
Diminishing Marginal Utility
Almost everything that people like, desire, use, or think they would like to use, gives satisfaction. The term that economists use for satisfaction is utility. Utility is defined as the power that a good or service has to satisfy a want. Based on utility, people decide what to buy and how much they are willing and able to pay at any given
time. In deciding to make a purchase, consumers think about the amount of satisfaction, or use, they think they will get from whatever item they are thinking about buying.
Consider the utility that can be derived from buying a cold soft drink at a baseball game on a hot day. At $4 per cup, how many will you buy? That decision depends on the additional utility, or satisfaction, you expect to receive from each additional soft drink. Your total satisfaction will rise with each one bought.
The amount of additional satisfaction, or marginal utility, however, will lessen with each additional cup bought. This example illustrates the law of diminishing marginal utility.
At some point, you will stop buying soft drinks. Maybe you don’t want to wait in line, or perhaps you are no longer thirsty.
Diminishing Marginal Utility
Regardless of how satisfying the first taste of an item is, additional satisfaction declines with additional consumption. Assume, for example, that at a price of $3.00 per bag of peanuts, you have enough after buying two bags. Thus, the value you place on additional satisfaction from a third bag of peanuts would be less than $3.00.
According to what will give you the most satisfaction, you will spend the $3.00 on something else. Eventually you would receive no additional satisfaction from more peanuts, even if the vendor gave them to you for free.
At that point, the satisfaction you get from the drink is less than the value you place on its cost. In general, people stop buying an item when the satisfaction from the next unit of the same item becomes less than the price they must pay for it.
What if, after the fifth inning, the price of soft drinks drops to $3? You might then buy at least one additional drink. Why? Remember, people will continue buying an item to the point at which the satisfaction from the last unit bought is equal to the price. At that point, people will stop buying. As the price of an item decreases, however, people will generally buy more.
- demand: the amount of a good or service that consumers are able and willing to buy at various possible prices during a specified time period
- supply: the amount of a good or service that producers are able and willing to sell at various prices during a specified time period
- market: the process of freely exchanging goods and services between buyers and sellers
- voluntary exchange: a transaction in which a buyer and a seller exercise their economic freedom by working out their own terms of exchange
- law of demand: economic rule stating that the quantity demanded and price move in opposite directions
- quantity demanded: the amount of a good or service that a consumer is willing and able to purchase at a specific price
- real income effect: economic rule stating that individuals cannot keep buying the same quantity of a product if its price rises while their income stays the same
- substitution effect: economic rule stating that if two items satisfy the same need and the price of one rises, people will buy more of the other
- utility: the ability of any good or service to satisfy consumer wants
- marginal utility: an additional amount of satisfaction
- law of diminishing marginal utility: rule stating that the additional satisfaction a consumer gets from purchasing one more unit of a product will lessen with each additional unit purchased
The Demand Curve and Elasticity of Demand
In first section about demand, you learned that quantity demanded is based on price. Demand, however, can be affected by a variety of factors, including changes in general economic conditions, the existence and price of substitutes, and changes in people’s tastes and preferences. Some of these other factors might explain the recent decrease in demand for Harley-Davidson motorcycles.
Graphing the Demand Curve
A demand curve is a graph that shows the relationship between the price of an item and the quantity demanded.
Economics & You If the price of a movie ticket suddenly went up to $20, how often would you go to the movies? What if the ticket price dropped to 50 cents? Read on to learn how this relationship between price and demand can be illustrated visually.
How can you learn to distinguish between a change in quantity demanded and a change in demand? And how do economists show these relationships in a visual way? It is said that a picture is worth a thousand words. In economics, the “picture” is often a graph that shows the relationship between two statistics or concepts.
The law of demand can be graphed. As you learned in Section 1, the relationship between the quantity demanded and price is inverse—that is, as the price of a good or service goes up, the quantity demanded goes down, and as the price goes down, the quantity demanded goes up.
Take a look at Table A and Graph B in Figure 7.3. These graphs show how the price of a particular good affects the quantity demanded at each price. Table A is a demand schedule—a table of prices and quantity demanded. The numbers show that as the price of DVDs decreases, the quantity demanded increases. For example, at a cost of $20 each, 100 million DVDs will be demanded. When the cost decreases to $12 each, 900 million DVDs will be demanded.
In Graph B, the numbers from the schedule in Graph A have been plotted onto a graph. The bottom (or horizontal) axis shows the quantity demanded. The side (or vertical) axis shows the price per DVD. Each pair of figures showing price and quantity demanded represents a point on the graph. These points are labeled A through K.
Finally, the line connecting points A through K is the demand curve. A demand curve shows the quantity demanded of a good or service at each possible price. Demand curves slope downward (that is, they fall from the left to the right). When you study Graph B, you can see clearly the inverse relationship between price and quantity demanded. As price falls, quantity demanded increases, and vice versa.
Figure 7.3 Graphing the Demand Curve
Note how the table and the graph each use a different format to show the same thing. Each shows the law of demand—as price falls, quantity demanded increases. Also, note that in Graph B we refer to the quantity of DVDs demanded per year. We could also have used a time period of one day, one week, one month, two years, etc.

Table A. Demand Schedule
The numbers in this demand schedule show that as the price per DVD decreases, the quantity demanded increases.

Graph B. Demand Curve
Here, the price and quantity demanded numbers from the demand schedule have been plotted on a graph and connected with a line. This line is the demand curve, which always falls from left to right.
Determinants of Demand
A change in the demand for a particular item shifts the entire demand curve to the left or right.
Economics & You Think of a product or service you used to buy a lot of but don’t anymore. Did this happen because of changing trends, a change in your income, or something else? Read on to learn about various factors that affect demand.
Many factors can affect demand for a specific product or service. Among these factors are changes in population, changes in income, changes in people’s tastes and preferences, the availability and price of substitutes, and the price of complementary goods.
Changes in Population
When the population increases, opportunities to buy and sell increase. Naturally, the demand for most products then increases. This means that the demand curve for, say, flat-screen televisions, shifts to the right. At each price, more flat-screen televisions will be demanded simply because the consumer population increases. This concept is shown in the graph on the left. The demand curve labeled D1 represents the demand for televisions before the population increased. The demand curve labeled D2 represents demand after the population increased.
In contrast, if the population decreases, overall demand for products also decreases. At each price, fewer flat-screen televisions will be demanded. When this happens, the demand curve shifts to the left.
Changes in Income
The demand for most goods and services depends on income. Your demand for DVDs would certainly decrease if your income dropped in half and you expected it to stay there. You would buy fewer DVDs at all possible prices. In the graph on the left, the demand curve D1 represents your demand for DVDs before your income dropped, and the demand curve D2 represents your demand for DVDs after your income dropped. If your income went up, however, you might buy more DVDs even if the price of DVDs doubled. Buying more DVDs at all possible prices would shift the demand curve to the right.
Changes in Tastes and Preferences
One of the key factors that determine demand is people’s tastes and preferences. Tastes and preferences refer to what people like and prefer to choose. When a product becomes a fad, more of the products are demanded and sold at every possible price. The demand curve then shifts to the right, as shown in the graph on the right. In the early 1990s, when Beanie Babies became a fad, the demand curve shifted from D1 to D2. As the popularity of this product died down, its demand curve then shifted back to the left.
Substitutes
As you learned in Section 1, substitutes are goods used in place of one another. The availability and price of substitutes also affect demand. For example, people often think of butter and margarine as substitutes. Suppose that the price of butter remains the same and the price of margarine falls. People will then buy more margarine and less butter at all prices of butter. This shift in the demand curve for butter is shown in the graph on the right. If, in contrast, the price of the substitute (margarine) increases, the demand for the original item (butter) also increases.
Complementary Goods
Complements are products that are generally bought and sold together. Digital cameras and flash memory, for example, are complementary goods. When two goods are complementary, the decrease in the price of one will increase the demand for it as well as its complementary good. If the price of digital cameras drops, for example, people will probably buy more of them. They will also probably buy more flash memory to use with the cameras.
Therefore, a decrease in the price of digital cameras leads to an increase in the demand for flash memory. As a result, the demand curve for flash memory will shift to the right, as shown in the graph on the right. The opposite would happen if the price of digital cameras increased. In this case, the demand for the complement, flash memory, would decrease, and the demand curve would shift to the left.
The Price Elasticity of Demand
Elasticity of demand measures how much the quantity demanded changes when price goes up or down.
Economics & You Do rising gas prices affect how much gas you are willing to buy? If not, then your demand for gas is inelastic. Read on to learn about price responsiveness or elasticity.
The law of demand is straightforward: The higher the price charged, the lower the quantity demanded—and vice versa. If you sold DVDs, how could you use this information? You know that if you lower prices, consumers will buy more DVDs. By how much should you lower the price, however? You cannot really answer this question unless you know how responsive consumers will be to a decrease in the price of DVDs.
Economists call this price responsiveness elasticity. The measure of the price elasticity of demand is how much consumers respond to a given change in price.
Figure 7.4 Demand vs. Quantity Demanded
Remember that there is a difference between a change in demand and a change in quantity demanded

Graph A. Change in Demand
This is caused by something other than a change in the product’s price, and it causes the entire demand curve to shift to the left or right.

Graph B. Change in Quantity Demanded
This is caused by a change in the price of a good, and it is shown as a movement along the demand curve.
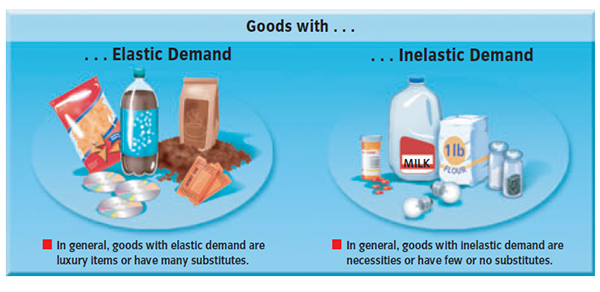
Elastic Demand
For some goods, a rise or fall in price greatly affects the amount people are willing to buy. The demand for these goods is considered elastic —consumers can be flexible about buying or not buying these items. For example, specific brands of coffee probably have a very elastic demand. Consumers consider the many competing brands of coffee to be almost the same. A small rise in the price of one brand will probably cause many consumers to purchase the cheaper substitute brands instead.
Another example of goods that are generally considered to have elastic demand is luxury items. Luxury items are things people might want but do not really need to survive. Expensive cars, high-end electronic items, and exotic vacations are all examples of luxury items. Some foods, especially expensive foods such as steak and lobster, are also considered luxury items. Because people do not need these things to survive, the demand for them is usually elastic.
Inelastic Demand
If a price change does not result in a substantial change in the quantity demanded, then demand for that particular good is considered inelastic. This means that consumers are usually not flexible with these items and will purchase some of the items no matter what they cost. In general, goods that are considered necessities, such as staple foods, spices like salt and pepper, and certain types of medicine, normally have inelastic demand.
Note that by using two demand curves together in one diagram—as shown in Figure 7.5 on page 184—you can compare a relatively inelastic demand with a relatively elastic demand at a particular price.

Figure 7.5 Elasticity of Demand
- Curve A at the price of $5.50 could represent the inelastic demand for pepper. Even if the price of pepper dropped dramatically, you would not purchase much more of it.
- Curve B at $5.50 could represent the elastic demand for steaks. If the price drops just a little, many people will buy much more steak.
What Determines Price Elasticity of Demand?
Why do some goods have elastic demand and others have inelastic demand? At least three factors determine the price elasticity of demand for a particular item: the existence of substitutes; the percentage of a person’s total budget devoted to the purchase of that good; and the time consumers are given to adjust to a change in price.
Clearly, the more substitutes that exist for a product, the more responsive consumers will be to a change in the price of that good. A diabetic needs insulin, which has virtually no substitutes. The price elasticity of demand for insulin, therefore, is very low—it is inelastic. The opposite is true for soft drinks. If the price of one goes up by very much, many consumers may switch to another.
The percentage of your total budget spent on an item will also determine whether its demand is elastic or inelastic. For example, the portion of a family’s budget devoted to pepper is very small. Even if the price of pepper doubles, most people will keep buying about the same amount. The demand for pepper, then, is relatively inelastic. Housing demand, in contrast, is relatively elastic because it represents such a large proportion of a household’s yearly budget.
Finally, people take time to adjust to price changes, and this time period also affects demand elasticity. If the price of electricity were to rise drastically tomorrow, you would have a hard time adjusting your behavior immediately. You would still need to use the same amount of electricity as you used yesterday. Your demand for electricity, therefore, is inelastic.
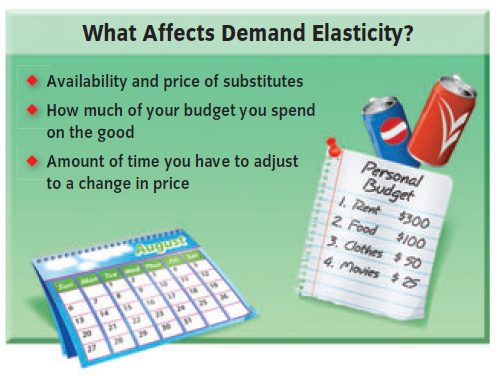
As more time goes by, however, you will be able to adjust the amount of electricity you use, gradually using less and less. Maybe you start using light bulbs with lower wattages, or you get used to a warmer house in the summer and a colder house in the winter, or you add insulation to your attic. The longer the time allowed to reduce the amount of electricity you use, the greater the price elasticity of demand for electricity will be for you.
- demand schedule: table showing quantities demanded at different possible prices
- demand curve: downward-sloping line that shows in graph form the quantities demanded at each possible price
- elasticity: economic concept dealing with consumers responsiveness to an increase or decrease in the price of a product
- price elasticity of demand: the economic concept that deals with how much demand varies according to changes in the price
- elastic demand: a situation in which a given rise or fall in a product’s price greatly affects the amount that people are willing to buy
- inelastic demand: the situation in which a product’s price change has little impact on the quantity demanded by consumers