Prices and inflation
- Details
- Category: Macroeconomics
- Hits: 8,876
Prices and price levels are fundamental concepts in economics that influence everyday life, affecting consumers, businesses, and policymakers alike. Understanding these concepts is crucial for making informed financial decisions, formulating economic policies, and assessing overall economic health. This article delves into the meaning of prices and price level, their determinants, impacts on the economy, and strategies for managing price fluctuations.
Prices and price level
What Are Prices?
Prices refer to the amount of money required to purchase goods and services in an economy. They are determined by the interaction of supply and demand in the market. Prices serve as essential signals, guiding consumer behavior and business production decisions.
Determinants of Prices
Several factors influence prices, including:
-
Supply and Demand: When demand exceeds supply, prices rise; when supply outpaces demand, prices fall.
-
Production Costs: Higher costs of raw materials, labor, and overheads increase the final price of goods and services.
-
Market Competition: Competitive markets generally lead to lower prices, while monopolies may set higher prices due to lack of alternatives.
-
Government Policies: Taxes, subsidies, and price controls impact pricing dynamics.
-
Global Factors: Exchange rates, international trade policies, and geopolitical events can affect domestic prices.
Understanding Price Level
The price level refers to the average price of a broad basket of goods and services in an economy over time. It is an indicator of inflation or deflation and is measured using price indices such as:
-
Consumer Price Index (CPI): Reflects changes in the cost of living by measuring the price of essential goods and services.
-
Producer Price Index (PPI): Tracks price changes from the perspective of producers.
-
GDP Deflator: Measures the overall level of prices of all domestically produced final goods and services.
Factors Influencing Price Level
Several factors contribute to changes in the price level, including:
1. Inflationary and Deflationary Pressures
-
Inflation: A sustained increase in the price level, eroding purchasing power.
-
Deflation: A general decline in the price level, increasing real debt burdens but making goods cheaper.
2. Monetary Policy
Central banks regulate money supply and interest rates to stabilize the price level. Expansionary monetary policies can increase inflation, while contractionary policies help control excessive price rises.
3. Fiscal Policy
Government spending and taxation influence aggregate demand, impacting price levels. High government spending can lead to inflation, while higher taxes may reduce disposable income and curb demand.
4. External Shocks
Natural disasters, geopolitical tensions, and supply chain disruptions can cause price fluctuations by affecting the availability of goods and raw materials.
Effects of Changes in Prices and Price Level
Price changes impact various sectors of the economy differently.
Impact on Consumers
-
Rising Prices: Reduce purchasing power, making everyday goods and services more expensive.
-
Stable Prices: Allow for predictable budgeting and financial planning.
-
Falling Prices: Benefit consumers in the short term but may signal economic distress.
Impact on Businesses
-
Higher Input Costs: Increase operational expenses, potentially reducing profitability.
-
Pricing Strategies: Companies adjust pricing to remain competitive while covering costs.
-
Investment Decisions: Stable price levels encourage long-term investments, while volatile prices increase uncertainty.
Impact on the Economy
-
Economic Growth: Moderate inflation supports economic expansion, while hyperinflation or deflation can lead to economic instability.
-
Interest Rates: Central banks adjust rates in response to price level changes, influencing borrowing and spending.
-
Wage Dynamics: Rising price levels may lead to wage increases, affecting labor costs.
Strategies to Manage Price Fluctuations
Governments, businesses, and individuals adopt various strategies to cope with changing prices and price levels.
1. Government Policies
-
Monetary Control: Central banks adjust interest rates to regulate inflation.
-
Fiscal Measures: Adjusting taxes and government spending helps stabilize demand.
-
Price Regulations: Implementing price ceilings or subsidies to control essential goods.
2. Business Approaches
-
Cost Efficiency: Improving productivity to minimize costs.
-
Diversification: Expanding product lines to mitigate risks associated with price changes.
-
Flexible Pricing: Adjusting prices based on market conditions and demand patterns.
3. Personal Financial Strategies
-
Hedging Against Inflation: Investing in assets like real estate, commodities, and inflation-protected securities.
-
Budgeting Smartly: Adjusting expenses to accommodate price fluctuations.
-
Savings Planning: Keeping savings in inflation-resistant instruments.
Price level and time
We are rarely interested in the value of the price level at a particular point in time. What we are interested in is the percentage change in the price level between two points in time. We calculate the percentage change by first creating a basket of goods and services. At regular intervals (usually once a month on the first day of the month) we measure all the prices of the contents of the basket (typically as an average of the market) and calculate the price level. In this way, we will end up with a time series of price levels – one value for each month.
Using this time series we can study how the price level evolves over time. If all prices rose by 2% during one month, the price level would rise by exactly 2%. If one of the prices rose by 2% while the other prices remained unchanged, the price level would rise, but by much less than 2%. Exactly how much it would raise would depend on the weight of the changed price.
Imagine that we have created a particular basket of goods and services. We calculate the price level at four different points in time during 2008 without changing the content of the basket (the weights are unchanged). Suppose that we find the following time series for the price level :
| Point in time | Jan 1, 2008 | Feb 1, 2008 | March 1, 2008 | April 1, 2008 |
| Price level | 60 770 | 62 400 | 62 850 | 62 850 |
Price index
Since we are only interested in the percentage change of the price level and not the particular value, we can divide each price level by a given constant so that the numbers are easier to deal with. When we divide a series of price levels by a constant we end up with what is called a time series of price indexes. Using the same basket as above, if we divide the entire series by 607.70 we get the following time series of price indexes:
| Point in time | Jan 1, 2008 | Feb 1, 2008 | March 1, 2008 | April 1, 2008 |
| Price index | 100 | 102.68 | 103.42 | 103.42 |
The reason for choosing 607.70 is that we want the index to be equal to 100 for the first point in time. The advantage of having an index that starts with 100 is that we will have a clearer picture of the evolution of prices. We may, for example, immediately conclude that prices rose by 2.68% on average in January and by 3.42% during the three months from January to March.
Note that the percentage change of the original price level and the percentage change of the price index is the same. The percentage change will not depend on which point in time we select as our “base” (giving the price index value of 100). Using the price index, the percentage change during January is (62400 – 60770)/60770 = 2,68% which is exactly the same as the percentage change of the price index.
Consumer Price Index (CPI)
Consumer Price Index (CPI) is a price index of a particular basket called the CPI-basket. The CPI-basket contains basically all the goods and service consumed in a country – food, gas, medicine, haircuts, transportation, house rent and so on. The composition of the CPI basket is determined by the value of what is consumed in the country – the larger the value of total consumption of a good or service, the larger the weight in the basket.
For example, if we spend twice as much on apples as on pears, apples will have twice the weight in the basket. The exact details of the composition of the basket and how the Consumer Price Index (CPI) is calculated are complicated and vary somewhat between countries. Figure 1 displays CPI for Germany after the reunification starting at January 1991. This data has 2005 as the reference year. This means that the CPI is constructed in such a way that CPI is exactly equal to 100 on average during 2005.
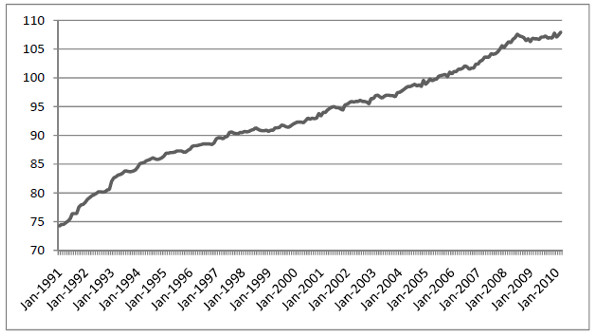
Figure 1.1 Consumer price index (CPI) for Germany 1991 – 2010. Source: OECD.
Problems with Consumer Price Index (CPI)
To illustrate the problems involved in calculating the CPI we consider MP3 players. If you measure the average price of MP3 players at two points in time, say one year apart, you may find that the average price has not changed.
However, this is not the whole story since the products on the market will have changed. Typically, the products at the later measurement are more advanced than the products at the first measurement. If you were to compare the prices of MP3 players with the same performance, you would probably find that prices have fallen. Without adjusting for changes in performance and quality, you will usually overestimate the rise in the price index.
Inflation
The inflation between two points in time is defined as the percentage increase of the price index between these two points in time. Comments:
- The price index is calculated at a particular point in time, inflation over a time period, typically one year
- Inflation may just as well be defined as the percentage change in the price level.
- Inflation is independent of which year we use as our base year for our price index.
- You often hear that inflation is the “percentage change in prices” but keep in mind that “prices” are then short for the price level.
- Since the price level may be defined in many different ways (using different goods and different weights in the basket), inflation may be defined in many different ways.
- If the price index decreases between two points in time we say that inflation is negative or that we have deflation.
Inflation in Germany
Once we have monthly data on a price index we can calculate the inflation. In most countries, the percentage change in the price index during one month is small. Therefore, it is more common to calculate the inflation each month based on an entire year.
For example, on 1 January 2010, inflation is calculated as the percentage change in the price index between 1 January 2010 and 1 January 2010. On 1 February 2010, inflation is calculated as the percentage change in price index between 1 February 2010 and 1 February 2010 and so on. Figure 1.2 shows Germany as an example.
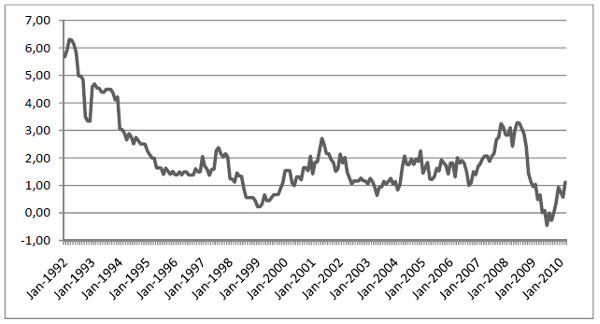
Figure 1.2 Inflation in Germany 1992 – 2010. Source: OECD.
Inflation in Sweden
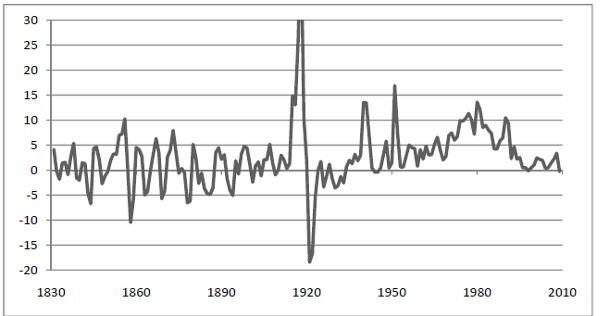
Figure 1.3 Inflation in Sweden 1830 – 2010. Source: SCB.
Four aspects are interesting when we look at inflation data for Sweden
- During the 1800s, when Sweden was mainly an agricultural society, deflation where almost as common as inflation.
- The “spikes” in 1918-1922 began with a speculative boom right at the end of World War I, which in turn was followed by a deep depression.
- In the period from the end of the Second World War 1945 to the economic crisis of the 1990s, Sweden had continuous inflation with no periods of deflation. Inflation was particularly high during the 1970s and the 1980s.
- From 1992 onwards Sweden has had a low and a relatively constant rate of inflation with regular periods of deflation. A major reason for the low inflation in Sweden, as for most OECD countries, is the priority given to combating inflation. Sweden now has an inflation target aiming to keep inflation to between 1% and 3%.
Understanding prices and price level is essential for navigating economic trends and making informed financial decisions. While moderate price changes are natural in a dynamic economy, excessive fluctuations can pose challenges. Through effective policies, business strategies, and financial planning, individuals and organizations can mitigate the adverse effects of price changes, ensuring economic stability and growth.