An Economy Producing Consumption Goods: Model I
- Details
- Category: Economics
- Hits: 4,753
Figure 1 depicts Model I. Here, we imagine an economy that produces only consumption goods. To keep Model I as simple as possible we further suppose that the only consumption good is cars. These cars are produced by firms which are staffed by the households and owned by the households.
To put it in the language of economics, the two factors of production are labor and capital, and the households own both of them. There is no role for government or for the rest-of-the-world in Model I, so these sectors are omitted.
The two sectors of this economy are represented by icons in Figure 2.1. Even though Model I is clearly not realistic as a description of an actual economy, it will allow us to see some basic relationships that are present in the most complex economies.
The cars that are produced by the firms flow from the firms to the households in Figure 2.1 and labor services flow from the households to the firms. Let’s suppose that the output of cars is one per worker per year. There are 100 workers, so the output of the firms is 100 cars per year. All 100 cars produced are delivered to the households.
The market for cars sets the price that households pay for a car, and let's suppose that turns out to be $10,000 per car. This implies that the annual consumption expenditure of households in Model I is $1,000,000 (= 100 cars • $10,000), where "•" means multiplication. .
That spending by households is income to the auto firms which distribute it to the factors of production, labor and capital. Suppose that in the labor market the wage has been established at $8,000 per year, so wages paid by the firms to households total $800,000 per year. Notice that firms are receiving more money from car sales than they pay out in wages. The difference is profit, in this case $200,000. The factor incomes that result from the production of autos are therefore $800,000 for labor and $200,000 for capital.
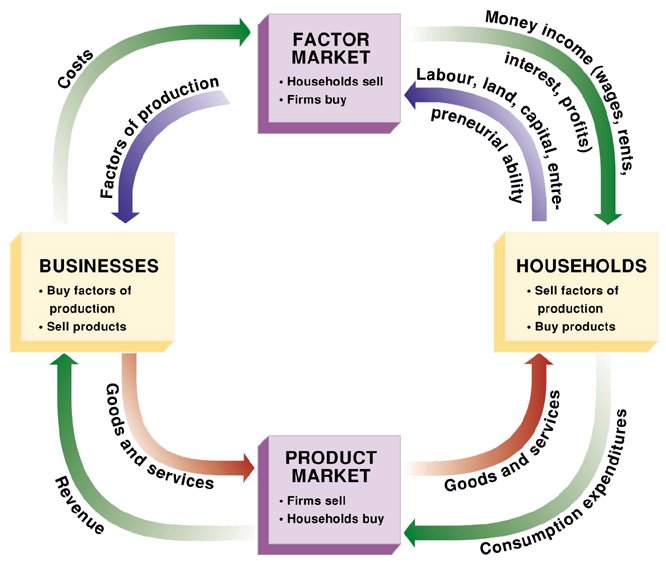
Figure 2.1: Product and Income Flows in Model I
Notice also that dollars flow clockwise in Figure 2.1, representing payments for the goods and services that flow counterclockwise. This illustrates the fact that there are two sides to any economy, the expenditure side and the income side, and they must be equal in dollar terms because every dollar spent on a good or service generates a dollar of income to the factors of production.
The market value of all the goods and services produced by an economy is called the National Product. It is $1,000,000 per year for Model I since that is the total expenditure for the cars that are produced.
The total of all factor incomes is called National Income. Since factor incomes account for all of the market value of the goods produced, it must be that National Income and National Product are equal. In other words, the total income of a society is the value of what it produces. This is a basic equality that holds even in the most complex economies.
Putting the value of what is produced in one column and the factor incomes arising from production in another column, we see the equivalence of these two sides of the Model I economy in the table below.
The left hand column shows that total expenditures in the economy are equal to National Product; the right hand column shows that the incomes of the two factors of production add up to National Income. Comparing the two totals, we see that National Product equals National Income as it always must.
Table 2.1: National Product and Income in Model I
|
Value of Goods Produced |
Factor Income |
||
|
Consumption goods |
$1,000,000 |
Wages |
$800,000 |
|
Profits |
200,000 |
||
|
National Product |
$1,000,000 |
National Income |
$1,000,000 |
Exercises 2.2
A. Imagine that the price of cars jumps to $20,000 and the wage to $16,000 per year. Rework the model. What has changed and what has not? Has the income of the society changed?
B. Now suppose that an improvement in production technology makes it possible for factory output to reach 1.2 cars per worker. Has the income of the society changed? What do you imagine would happen to wages? Suppose that the new level of wages is $9,000 per year; show what the flows of goods and incomes look like now.