Unemployment
- Details
- Category: Economics
- Hits: 3,247
Unemployment is a challenging and distressing experience, often compared to a major life upheaval like a severe accident or a difficult divorce. Those affected face financial uncertainty, stress, and lifestyle adjustments, such as depleting savings, downsizing, or relocating to a more affordable home. Even after finding new employment, the job may pay less than the previous one, impacting an individual’s self-worth, family relationships, and overall well-being.
The U.S. unemployment rate is determined through a monthly survey by the U.S. Bureau of the Census. It categorizes adults as employed, unemployed, or out of the labor force. To be considered unemployed, an individual must be jobless, available to work, and actively seeking employment within the last four weeks. Those who do not meet these criteria are classified as out of the labor force.
-
Employed: Currently working for pay
-
Unemployed: Out of work and actively job-seeking
-
Out of the labor force: Not employed and not actively looking for work
-
Labor force: The sum of employed and unemployed individuals
Calculating the Unemployment Rate
The unemployment rate is the percentage of unemployed individuals within the labor force. As of January 2017, 62.9% of the U.S. adult population was part of the labor force. The formula for calculating unemployment is:
Unemployment Rate = (Unemployed / Total Labor Force) x 100
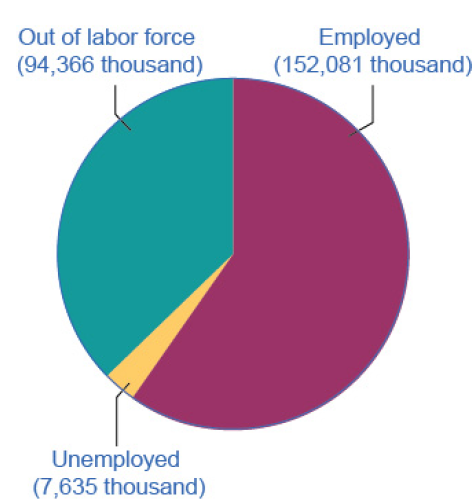
Figure 1 Employed, Unemployed, and Out of the Labor Force Distribution of Adult Population (age 16 and older), January 2017
The total adult, working-age population in January 2017 was 254.1 million. Out of this total population, 152.1 were classified as employed, and 7.6 million were classified as unemployed. The remaining 94.4 were classified as out of the labor force. As you will learn, however, this seemingly simple chart does not tell the
whole story.
Table 1 U.S. Employment and Unemployment, January 2017
|
Total adult population over the age of 16 |
254.082 million |
|
In the labor force |
159.716 million (62.9%) |
|
Employed |
152.081 million |
|
Unemployed |
7.635 million |
|
Out of the labor force |
94.366 million (37.1%) |
Unemployment carries both human and economic costs. High unemployment results in lost productivity, comparable to a factory operating below capacity. Addressing unemployment is crucial for both individuals and society.
This chapter explores how economists define and measure unemployment, analyze trends across demographics and countries, and propose policies to mitigate its impact.
Measuring Unemployment
By the end of this section, you should be able to:
-
Calculate the labor force participation and unemployment rates
-
Understand hidden unemployment and labor force classifications
-
Assess how unemployment data is collected and interpreted
Media reports often present unemployment as a percentage. For example, between August and November 2009, the U.S. unemployment rate increased from 9.7% to 10.0% before declining to 9.5% by June 2010. Though these fluctuations may seem minor, each 0.1% shift represents approximately 160,000 workers—a population equivalent to cities like Syracuse, New York, or Pasadena, California. During the 2009 recession peak, about 15 million people were unemployed, dropping to 7.6 million by early 2017, when the unemployment rate reached 4.8%.
Who’s Counted in the Labor Force?
Not everyone without a job is considered unemployed. Children, retirees, full-time students, and individuals taking career breaks or caring for family members are categorized as out of the labor force. Some people stop looking for work due to discouragement and are also excluded from unemployment statistics.
In January 2017, out of 254.1 million working-age adults, 152.1 million were employed, 7.6 million were unemployed, and 94.4 million were out of the labor force. Using these figures, the unemployment rate was calculated as:
7.635 million / 159.716 million = 4.8% unemployment rate
Hidden Unemployment
Some individuals are misclassified in labor statistics. Those working part-time but seeking full-time employment, as well as those overqualified for their jobs, fall under hidden unemployment. A college graduate working in retail, for example, is underemployed but still counted as employed. Additionally, discouraged workers who have stopped job searching are excluded from unemployment figures.
Labor Force Participation Rate
Another key statistic is the labor force participation rate, which measures the proportion of working-age adults who are employed or actively seeking work. Using January 2017 data:
Labor Force Participation Rate = (Labor Force / Adult Population) x 100
At 62.9%, participation has declined from a peak of over 67% in 1999-2000 due to economic changes, demographic shifts, and the effects of the Great Recession.
The Establishment Payroll Survey
Each month, the Bureau of Labor Statistics (BLS) releases employment data from the establishment payroll survey, covering about 147,000 businesses. It tracks payroll employment, work hours, and earnings but excludes self-employed individuals. One limitation is that it does not differentiate between part-time, temporary, and full-time jobs.
How the U.S. Bureau of Labor Statistics Collects Data
The Current Population Survey (CPS), conducted since 1940, provides unemployment statistics. The U.S. is divided into 3,137 areas, from which 729 are selected for monthly household surveys. About 60,000 households are interviewed each month, providing demographic breakdowns of employment trends.
CPS vs. EPS
-
Current Population Survey (CPS): Conducted by the Census Bureau to measure labor force participation and unemployment
-
Establishment Payroll Survey (EPS): Tracks job creation and employment trends based on business payroll data
Challenges in Measuring Unemployment
Unemployment measurement has limitations. Some jobless individuals stop looking due to discouragement, placing them outside the labor force category, even though they face financial struggles. Others might underreport informal work, while some claim to be seeking employment without actively searching.
Despite these imperfections, unemployment data remains a vital tool for assessing labor market health and informing policy decisions.
Patterns of Unemployment
Let’s look at how unemployment rates have changed over time and how various groups of people are affected by unemployment differently.
The Historical U.S. Unemployment Rate
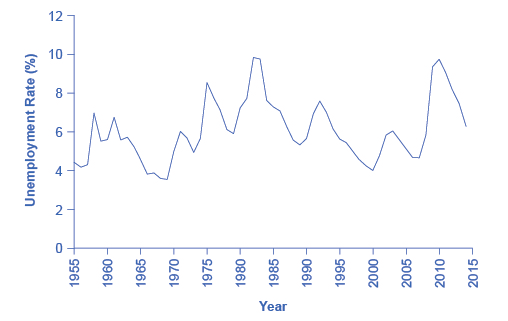
Figure 2 shows the historical pattern of U.S. unemployment since 1955.
Figure 2 The U.S. Unemployment Rate, 1955–2015 The U.S. unemployment rate moves up and down as the economy moves in and out of recessions. However, over time, the unemployment rate seems to return to a range of 4% to 6%. There does not seem to be a long-term trend toward the rate moving generally higher or generally lower.
As we look at this data, several patterns stand out:
-
Unemployment rates do fluctuate over time . During the deep recessions of the early 1980s and of 2007–2009, unemployment reached roughly 10%. For comparison, during the 1930s Great Depression, the unemployment rate reached almost 25% of the labor force.
-
Unemployment rates in the late 1990s and into the mid-2000s were rather low by historical standards . The unemployment rate was below 5% from 1997 to 2000, and near 5% during almost all of 2006–2007, and 5% or slightly less from September 2015 through January 2017 (the latest date for which data are available as of this writing). The previous time unemployment had been less than 5% for three consecutive years was three decades earlier, from 1968 to 1970.
-
The unemployment rate never falls all the way to zero . It almost never seems to get below 3%—and it stays that low only for very short periods. (We discuss reasons why this is the case later in this chapter.)
-
The timing of rises and falls in unemployment matches fairly well with the timing of upswings and downswings in the overall economy, except that unemployment tends to lag changes in economic activity, and especially so during upswings of the economy following a recession. During periods of recession and depression, unemployment is high. During periods of economic growth, unemployment tends to be lower.
-
No significant upward or downward trend in unemployment rates is apparent . This point is especially worth noting because the U.S. population more than quadrupled from 76 million in 1900 to over 324 million by 2017. Moreover, a higher proportion of U.S. adults are now in the paid workforce, because women have entered the paid labor force in significant numbers in recent decades. Women comprised 18% of the paid workforce in 1900 and nearly half of the paid workforce in 2017. However, despite the increased number of workers, as well as other economic events like globalization and the continuous invention of new technologies, the economy has provided jobs without causing any long-term upward or downward trend in unemployment rates.
Unemployment Rates by Group
Unemployment is not distributed evenly across the U.S. population. Figure 3 shows unemployment rates broken down in various ways: by gender, age, and race/ethnicity.
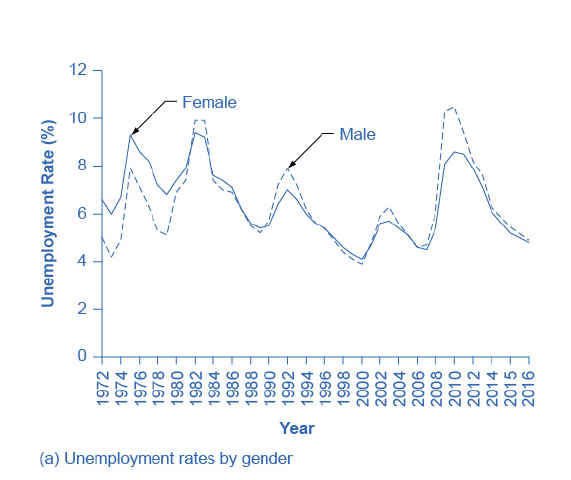
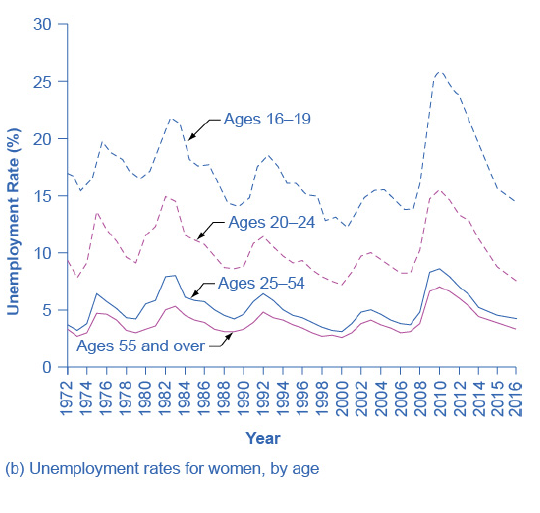
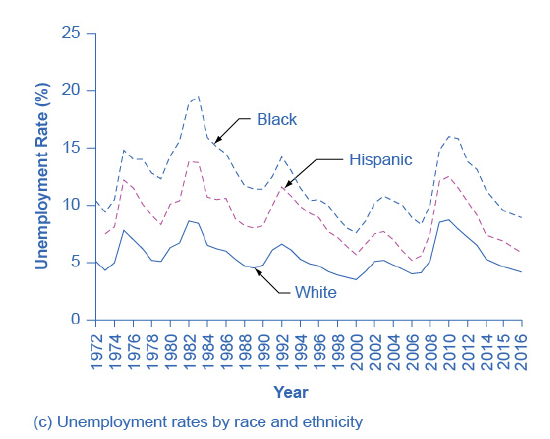
Figure 3 Unemployment Rate by Demographic Group
(a) By gender, 1972–2016. Unemployment rates for men used to be lower than unemployment rates for women, but in recent decades, the two rates have been very close, often– and especially during and soon after the Great Recession – with the unemployment rate for men somewhat higher.
(b) By age, 1972–2016. Unemployment rates are highest for the very young and become lower with age.
(c) By race and ethnicity, 1972–2016. Although unemployment rates for all groups tend to rise and fall together, the unemployment rate for blacks is typically about twice as high as that for whites, while the unemployment rate for Hispanics is in between.
The unemployment rate for women had historically tended to be higher than the unemployment rate for men, perhaps reflecting the historical pattern that women were seen as secondary earners. By about 1980, however, the unemployment rate for women was essentially the same as that for men, as Figure 3 (a) shows. During the 2008-2009 recession and in the immediate aftermath, the unemployment rate for men exceeded the unemployment rate for women. Subsequently, however, the gap has narrowed.
Younger workers tend to have higher unemployment, while middle-aged workers tend to have lower nemployment, probably because the middle-aged workers feel the responsibility of needing to have a job more heavily. Younger workers move in and out of jobs more than middle-aged workers, as part of the process of matching of workers and jobs, and this contributes to their higher unemployment rates. In addition, middle-aged workers are more likely to feel the responsibility of needing to have a job more heavily. Elderly workers have extremely low rates of unemployment, because those who do not have jobs often exit the labor force by retiring, and thus are not counted in the unemployment statistics. Figure 3 (b) shows unemployment rates for women divided by age. The pattern for men is similar.
The unemployment rate for African-Americans is substantially higher than the rate for other racial or ethnic groups, a fact that surely reflects, to some extent, a pattern of discrimination that has constrained blacks’ labor market opportunities. However, the gaps between unemployment rates for whites and for blacks and Hispanics diminished in the 1990s, as Figure 3 (c) shows. In fact, unemployment rates for blacks and Hispanics were at the lowest levels for several decades in the mid-2000s before rising during the recent Great Recession.
Finally, those with less education typically suffer higher unemployment. In January 2017, for example, the unemployment rate for those with a college degree was 2.5%; for those with some college but not a four year degree, the unemployment rate was 3.8%; for high school graduates with no additional degree, the unemployment rate was 5.3%; and for those without a high school diploma, the unemployment rate was 7.7%. This pattern arises because additional education typically offers better connections to the labor market and higher demand. With less attractive labor market opportunities for low-skilled workers compared to the opportunities for the more highlyskilled, including lower pay, low-skilled workers may be less motivated to find jobs.
Breaking Down Unemployment in Other Ways
The Bureau of Labor Statistics also gives information about the reasons for unemployment, as well as the length of time individuals have been unemployed. Table 2 , for example, shows the four reasons for unemployment and the percentages of the currently unemployed that fall into each category. Table 3 shows the length of unemployment.
For both of these, the data is from January 2017.
Table 2 Reasons for Unemployment, January 2017
| Reason | Percentage |
| New Entrants | 10.80% |
| Re-entrants | 28.70% |
| Job Leavers | 11.40% |
| Job Losers: Temporary | 14.00% |
| Job Losers: Non Temporary | 35.10% |
Table 3 Length of Unemployment, January 2017
| Length of Time | Percentage |
| Under 5 weeks | 32.50% |
| 5 to 14 weeks | 27.50% |
| 15 to 26 weeks | 15.70% |
| Over 27 weeks | 27.40% |
International Unemployment Comparisons
From an international perspective, the U.S. unemployment rate typically has looked a little better than average. Table 4 compares unemployment rates for 1991, 1996, 2001, 2006 (just before the recession), and 2012 (somewhat after the recession) from several other high-income countries.
Table 4 International Comparisons of Unemployment Rates
| Country | 1991 | 1996 | 2001 | 2006 | 2012 |
| United States | 6.80% | 5.40% | 4.80% | 4.40% | 8.10% |
| Canada | 9.80% | 8.80% | 6.40% | 6.20% | 6.30% |
| Japan | 2.10% | 3.40% | 5.10% | 4.50% | 3.90% |
| France | 9.50% | 12.50% | 8.70% | 10.10% | 10.00% |
| Germany | 5.60% | 9.00% | 8.90% | 9.80% | 5.50% |
| Italy | 6.90% | 11.70% | 9.60% | 7.80% | 10.80% |
| Sweden | 3.10% | 9.90% | 5.00% | 5.20% | 7.90% |
| United Kingdom | 8.80% | 8.10% | 5.10% | 5.50% | 8.00% |
However, we need to treat cross-country comparisons of unemployment rates with care, because each country has slightly different definitions of unemployment, survey tools for measuring unemployment, and also different labor markets. For example, Japan’s unemployment rates appear quite low, but Japan’s economy has been mired in slow growth and recession since the late 1980s, and Japan’s unemployment rate probably paints too rosy a picture of its labor market.
In Japan, workers who lose their jobs are often quick to exit the labor force and not look for a new job, in which case they are not counted as unemployed. In addition, Japanese firms are often quite reluctant to fire workers, and so firms have substantial numbers of workers who are on reduced hours or officially employed, but doing very little. We can view this Japanese pattern as an unusual method for society to provide support for the unemployed, rather than a sign of a healthy economy.
Comparing unemployment rates in the United States and other high-income economies with unemployment rates in Latin America, Africa, Eastern Europe, and Asia is very difficult. One reason is that the statistical agencies in many poorer countries lack the resources and technical capabilities of the U.S. Bureau of the Census. However, a more difficult problem with international comparisons is that in many low-income countries, most workers are not involved in the labor market through an employer who pays them regularly.
Instead, workers in these countries are engaged in short-term work, subsistence activities, and barter. Moreover, the effect of unemployment is very different in high-income and low-income countries. Unemployed workers in the developed economies have access to various government programs like unemployment insurance, welfare, and food stamps. Such programs may barely exist in poorer countries. Although unemployment is a serious problem in many low-income countries, it manifests itself in a different way than in high-income countries.