U.S. business cycles
- Details
- Category: Economics
- Hits: 8,656
The vast studies of business cycles are invaluable to the possibilities of understanding the state of the macro economy and to be able to predict the future movements of the economy. Many of the most famous economists in history, such as Keynes and Schumpeter have been researching this subject, but in this section I will mainly use the research by The National Bureau of Economic Research (NBER) as their research is widely accepted among economists in the U.S. today.
This section will give an introduction to the different business cycle stages and how they are measured by NBER.
Defining the business cycle
Burns and Mitchell (1946) defined business cycles as fluctuations in aggregate economic activity of nations that organize their work mainly in business enterprises. They also stated that a cycle consist of expansions occurring at about the same time in many economic activities, followed by similarly general recessions, contractions and revivals that merge into the expansion phase of the next cycle.
With this in mind, and to be able to use NBER business cycle dating, I will not use the simplified definition of a recession which is often used by the daily press, that is; the economy is in a recession when it experience negative growth in GDP for two consecutive quarters. I will instead use the following NBER definition of a recession;
A significant decline in economic activity spread across the economy, lasting for more than a few months” . In other words the economy enters a recession when it is suffering negative developments in multiple economic indicators, not just the GDP, resulting in a fall in total economic activity until it reaches a business cycle trough. While this definition is much broader, it also has some clear advantages.
First, GDP comes with a considerable lag and often suffers from multiple revisions. With this definition you don’t rely solely on GDP data but rather on a mix of economic indicators which give a broader measure of total economic activity. As a measure of this business cycle the conference board has developed a coincident index (CI) which is a weighted group of economic indicators put together to form an index which follows the developments of the total economic activity.
The indicators included in this index are; the weighted value of the number of employees on Non- agricultural payrolls, personal income less transfer payments, Index of industrial production and manufacturing and trade sales (Zarnowitz 2004). Since this index has proven a good track record as a measure of the US economic activity I will refer to this as the main measure of US business cycles.
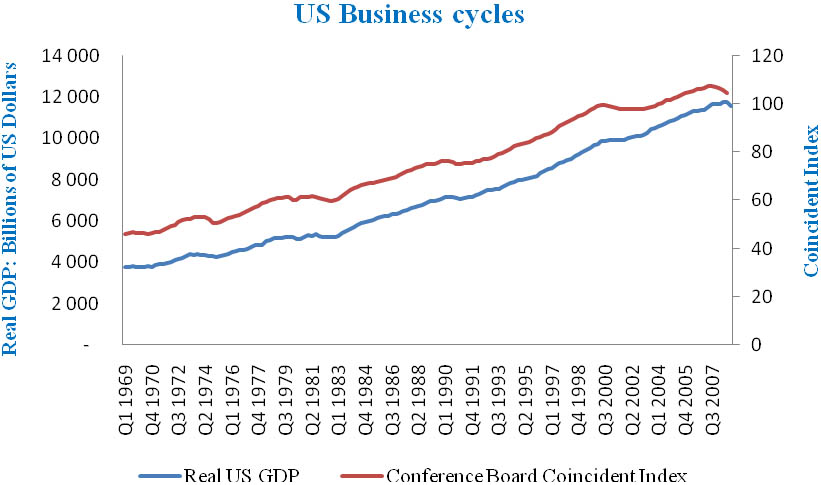
Figure 1 holds GDP values on the left axis in billions of US dollars, while the right axis holds the CI values. The curves show the level values of both variables and visualize the strong relationship between them. Although GDP is not part of the CI it still holds valuable information about the state of the economy, and is moving close to the conference board CI with a correlation at 99.5.
What is striking about figure 1 is that the business cycles seem to hold more magnitude in the CI than in GDP. Especially the recessions starting in 1973 and 2001 holds bigger traces in the CI. This suggests that the total economic activity actually have suffered more during recessions than what is measured through GDP.
| Peak | Trough |
| December 1969 | November 1970 |
| November 1973 | March 1975 |
| January 1980 | July 1980 |
| July 1981 | November 1982 |
| July 1990 | March 1991 |
| March 2001 | November 2001 |
| December 2007 |
Table 1 - NBER Business cycle reference dates

Figure 1 - US Business cycles pictured by the Conference Board’s Coincident Index and Real GDP. Quarterly data.
Table 1 holds the business cycle reference dates from 1969 produced by NBER. The dates includes the exact month when the economy reached a business cycle peak or trough based upon the coincident indicators and national income available at the time (Zarnowitz 2004). Still after revisions both the CI and GDP follow the NBER dates, and do not seem to hold any other turning points than the ones dated by NBER.
The different stages of the business cycle
After a closer analysis of the business cycle dates set by NBER back until the peak in June 1857, it is hard to find any other systematic besides the fact that the cycles are recurrent. There are no firm periodic structures neither in the length of the cycles nor the periodicity.
The average length from peak-to-peak of the cycles after 1945 has been between 5 and 6 years, although the cycles of the later years seems to have been somewhat longer with an average of close to 9 years for the cycles after the peak in July 1990. But although the cycles have differed in duration and magnitude they share some familiar technical characteristics.

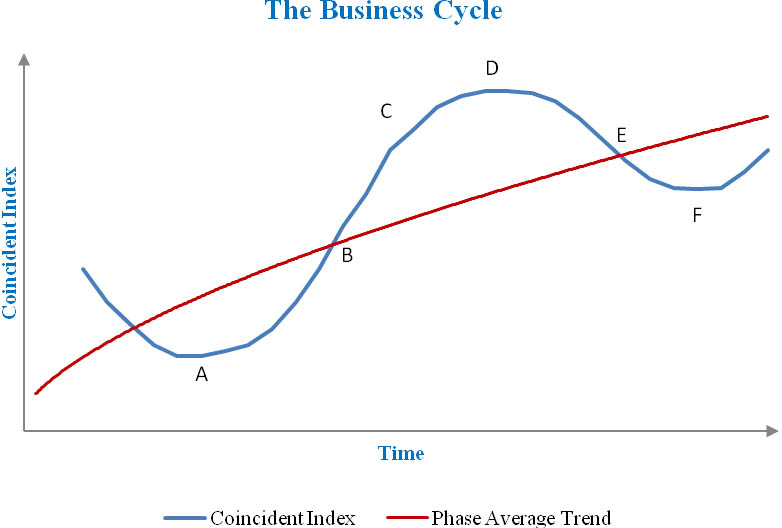
Figure 2 - Stages of expansion and contraction (Based on figure 2.3, Zarnowitz 2004)
Figure 2 gives a picture of how a business cycle generally looks like, and gives an introduction to the most common technical characteristics. The economy, represented by the coincident index, first experiences a trough and hence the end of a recession at point A.
The economy then enters a recovery stage between point A and B where the negative growth from the last recession, which has lead to developments below the trend line, is regained when the CI reaches point B. In the next stage between point B and C the positive growth sustains as the CI rises to achieve net gains above the trend line and the latest business cycle peak.
In this stage the economy often enters a state better fit to terms like “boom” or “euphoria”, but this is not a necessity. In point C the business cycle growth rate deteriorates as the economy enters a stage of slowdown followed by the cycle peak in point D. After experiencing positive growth rates from point A up to point D the economy now suffers from negative trends and enters a recession. First with a downturn from the peak at point D towards the phase average trend at point E, and second with a further decline from the phase average trend until reaching a new business cycle trough in point F (Zarnowitz 2004).
This model takes on the assumption that the economy experiences net positive growth between each business cycle peak, which according to Victor Zarnowitz’ research (2004) normally has been the case.
While this is not a necessity in the future, the simple and generalized explanation of the different stages is a good introduction to what the cycles generally look like. As none of the past cycles have been identical, a more detailed model on the different stages is of less relevance in this paper. To this research the importance lies in understanding the basic structures in a goal of creating expectations on how the current business cycle will develop in the future.
For a more detailed analysis on the developments in the different stages I will refer to the work of Charles P. Kindleberger and Robert Z. Aliber in their book; Manias, Panics and Crashes: A history of financial crises.