Analysis and interpretation of the annual report
- Detalii
- Categorie: Accounting
- Accesări: 9,722
Statement of changes in equity: its contents and informational aims
The statement of changes in equity shows a detail of the changes of the equity from the beginning to the end of the year. The main reason for the equity to change is, as explained in section 4.3 above, due to the retained profit contribution to the distributable reserves. However, many other events can affect the equity.
When reading an annual report you must be aware of the following most common reasons for changes of the equity:
- Issue of new shares. In this case the increases of share capital and share premium reserve are balanced by an increase in cash and debtors
- Revaluation of properties. In this case the increase of the revaluation reserve is balanced by an increase in value of the non current assets
- Changes in value of certain financial instruments. This occurs when some financial instruments, such as shares, derivatives, etc., are treated at their ‘fair value through profit and loss’. The matter is regulated by IAS 39 and is, at the moment of writing this study guide, subject to a ‘relaxation’ of this rule
- Changes due to translation from foreign currencies. This derives from the changes in value of assets and liabilities which are denominated in different currencies in the subsidiaries that are part of the reporting entity and had to be ‘translated’ into the reporting currency. This translation might have created losses of gains from one year to the other.
Refer to your chosen annual report and read the statement of changes in equity. To make sense of it, you will need to read some of the relevant notes to the accounts, on the other hand you might find that some of the items are very technical, but this should not impede your effective insight in the reporting entity’s movements of equity.
Analysis and interpretation of the annual report
The narrative component of the annual report
As we have seen so far, the annual report provides its readers with a large amount of information about the performance and situation of the reporting entity. You can think of all this information as different ‘lenses’ through which to analyse the same object, i.e. the reporting entity. As any tool, also these ‘lenses’ can be used effectively or misused, hence some guidance on how to use them must be sought.
This is provided by the abundant information that is normally contained in the narrative parts of the annual report. The directors’ report, the operating and financial review and the other possible sections of the annual report provide different keys to interpret the figures reported in the accounts. Your interpretation of the accounts must consider these proposed views, but should also be critical of them.
On the one hand, it is widely recognised among analysts that the more information is included in the annual report, which can ease the insight in the performance and situation of the entity, the less uncertainty and risk are attached to the entity’s values and prospective performance. On the other hand, the very nature of this information allows the directors to steer the attention of the readers towards certain results as opposed to others, biasing their judgement about the performance and situation of the entity.
A typical example occurs when an increase in turnover is highlighted, whilst its negative effects on the profitability are not mentioned. Another example is provided by directors pointing the attention to the underling performance of the year, but neglecting that ‘exceptional’ events have completely undermined it during the financial year – or vice versa according to what makes the picture more convenient.
Ratio analysis
Ratios enable to form an insight into the different aspects of the performance and financial situation of a reporting entity, by calculating the relationships between various values of the accounts. The results of these calculations must be interpreted in light of the entity’s strategy and targets, of its past results and of the results of its competitors or broader industry averages.
Profitability analysis
As one of the main aims of the reporting entity is to maximise the wealth of its owners in the medium and long term, an important question to pose when starting the analysis of the entity is whether this aim has been achieved. Profitability, from the owners’ point of view, means how much profit attributable to them has been produced, given their investment in the entity. The profit attributable to the owners is, as explored above, the net profit (normally after tax), whilst the owners’ investment is represented by the equity, making the Return on Equity as follows:
ROE = net profit / equity.
Although the owners have directly invested only the amount of money represented by the share capital and the share premium reserve (see chapter 3 above), their interest in the entity is represented by the entire equity, as this includes other reserves of capital accumulated by the entity from the use of its own assets, i.e. profit, or from their revaluation. Hence, the equity is made of capital that in various forms and more or less directly is attributable to the owners.
A more detailed aspect of the profitability of the entity explores the amount of wealth that the entity has created by using the resources made available for its operations. We are looking, in this case, at the operating profit, i.e. the profit made from the operations, regardless how these are financed (remember that operating profit is calculated before deducting the cost of financing).
The operating profit was made possible by the use of the resources that normally employed in the entity for its operations. These are represented by the that amount of assets that is financed by long term sources of capital, such as equity and long term liabilities. Hence, the formula for capital employed is:
Capital employed = equity + long term liabilities
This means that the capital employed includes all the non-current assets and those current assets, which are constantly employed. Examples of this part of the current assets are: the oil in long pipelines, whereby a certain amount of oil must be constantly present in the pipeline for the pipeline to work, despite this oil is a current asset and despite its very fast movement, it still represents a constant investment; grocery on the outlets’ shelves, whereby there need to be an average amount of grocery constantly on the shelves for the business to operate, and regardless of how fast this grocery turns over, that capital is constantly invested in that grocery. Seen from a different point of view (refer to the accounting equation explained in chapter 3), this formula is also:
Capital employed = total assets – current liabilities
In this second version the capital employed is seen as the total amount of assets from which the volatile element of current assets is removed. The volatile element of current assets is that part of current assets financed by current liabilities, which are affected by a similar volatility. Once again, this leads to considering the capital employed as the amount of capital that is constantly or normally employed. Hence the formula for Return on Capital Employed is:
ROCE = operating profit / capital employed.
Whether you decide to use operating profit including exceptional events or you prefer to stick with the underline performance, i.e. the performance that does not consider the exceptional events and the discontinued activities, depends on the aim of your analysis; are you investigating the performance of a specific period of time, or are you trying to understand the potential of the entity in its core operations?
Further analysis will most likely break in two avenues: one aimed at exploring the margins, i.e. the level of prices in comparison with the costs of producing and selling, and the other aimed at exploring the pace of the capital turnover, i.e. how fast the capital employed is renewed in a year. Formally, this is done by calculating respectively Return on Sales and Asset TurnOver:
ROS = operating profit / sales
ATO = sales / capital employed
The obvious relationship ROS X ATO = ROCE is quite meaningful. It says that the profitability of the core operations is made of a combination of pace of the turnover of the capital and margins. In other terms, if an entity’s strategy is based on selling high volumes of products or services at low prices, this analysis will most likely show high ATO and low ROS. Typical examples of such a strategy are found in the retail industry, where the large chains of retail shops embark in fierce price competitions to lure customers from each other aiming at expanding their volumes of sales as much as possible.
Obviously their margins per unit of product are reduced to the minimum. If an entity’s strategy is based on selling products or services to selected segments of the market at high prices, this analysis will most likely show low ROS and high ATO. Typical examples of such a strategy are found in the deluxe products industries, e.g. precious objects, jewelleries, etc. where a high margin for each unit of product sold is obtained but the volume of sales is relatively low.
The combined effect of margin and volume, i.e. ROS and ATO can lead to a better ROCE in either of the strategies. Although it is normally possible to identify quite clearly if the strategy of an entity is more on the high-volume-low-margin or low-volume-high-margin direction, often attempts are made to increase both volumes and margins. Typically, you should reflect on the accounting effects of new lines of premium products in the high-volume-low-margin context, e.g. the ‘organic’ product line in a supermarket chain; the margins per unit will increase and the volume will be, probably, unaffected.
On the other hand, you should reflect on the effects of a new line of less pricy (and less expensive to produce) clothing to be added to a prestigious brand; the margins per unit will be marginally, if at all, reduced, but the volumes will increase significantly as an entire new segment of the market is targeted.
Select a number of entities, of which you have some knowledge, and which are operating in the same industry, obtain their accounts and work out the three ratios: ROCE, ROS and ATO. You should be able to position them in a matrix as in figure 7. Their positions will most likely confirm your prior knowledge about their brand strategy but also, maybe, reserve some unexpected results.
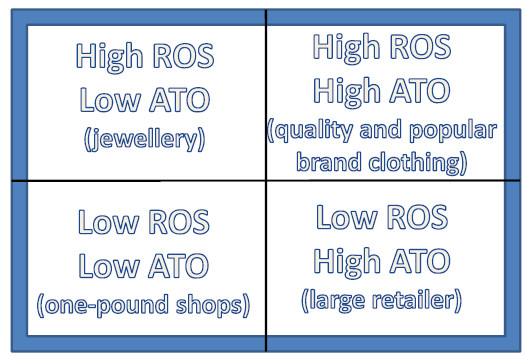
Figure 7 – matching brand strategy with accounting results
Further, you will find it useful to calculate other ratios, aimed at exploring the components of the ROS and ATO.
Exploring ROS
Gross profit percent, i.e. how much gross profit is made for every .100 of sales, represents the ability of the entity to add value to the resources it has consumed for the production of what has been sold. This result enables to investigate even more closely the accounting effects of the consumers’ and clients’ perceived quality of the entity’s products or services (see above chapter 4 on Income statement).
On the other hand, the effort that the entity has made, in order to create such a perception of quality, is reflected in the distribution, administrative and other operating costs. Hence, the valuation of these costs, too, as a percentage of the sales gives an effective comparative tool between different entities.
Exploring ATO
The turnover of the entity’s non-current assets and the turnover of the entity’s working capital, respectively ‘calculated as sales divided by non-current assets’ and ‘sales divided by working capital’, will give some insight on how effective the entity is, in comparison with its competitors, in using its non-current assets and how efficient it is in using its current assets. Respectively, the higher the no-ncurrent assets turnover, the more effective the entity is, as it is able to obtain more sales from those assets; the higher the working capital turnover, the more efficient the entity is in making its current assets flow at a fast pace.
The sequence of ratios linked in a sort of cascade as explained so far is called the ‘pyramid of ratios’, as illustrated in figure 8.
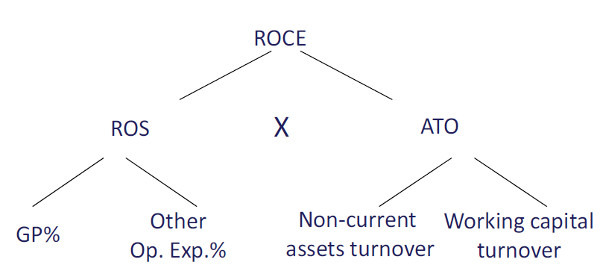
Figure 8 – the pyramid of ratios
Solidity and solvency
The conceptual difference between ROE and ROCE is explained above, in terms of purposes and use of the two ratios. However, in managerial terms, there is link between the two ratios; the difference in value between the two ratios is originated by the amount of debt exposure of the entity. If the value of the equity is kept constant, increasing long term liabilities implies an increase of the capital employed.
As a consequence, the entity can count on more resources with which to produce more operating profit, at a pace measured by ROCE. If the additional finance cost created by the additional long term liability does not exceed the increase of operating profit, the net profit will increase, too, hence improving the ROE. See figure 8.
The amount of long term liabilities in respect of the amount of equity is called Gearing and is measured with the following formula:
Gearing = long term liabilities / equity
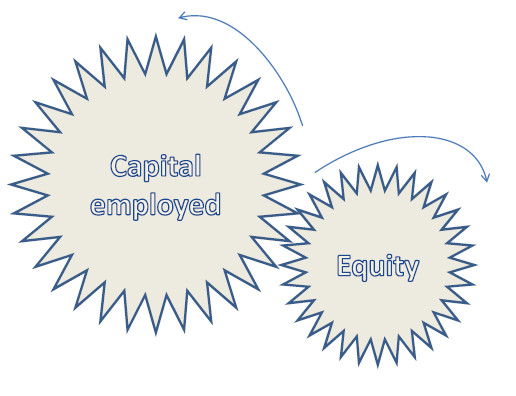
Figure 8 – the gearing effect on the size of an entity
It might seem, as a corollary of the above explanation, that the higher the gearing is, the better it is for the owners of the business, because of its multiplier effect of the profitability. However, the effect of high gearing is also that the risk of the entity increases, as the entity is committed to more and more debt to be paid back (principal) and paid for (interest). Should the ROCE decline, the entity might find itself over-exposed towards its lenders and using more resources than it is creating, i.e. reducing the owners’ wealth instead of maximising it.
In fact, as a general rule, there is a point of the expansion of any entity where further expansion will result in reduction of ROCE, because less profitable markets will have to be targeted and because the costs of coordination of an ever expanding entity will increase more than proportionally of the benefits they create.
Equally, there is a point of a gearing-based expansion, beyond which the cost of financing the expansion will be more than proportional to the amount of new raised capital, which is due to the increasing risk that the lenders attach to the entity. Hence, there is a point in the way of an ever expanding entity, where expanding is no longer logical, as its cost overcomes its benefit. A wise management must identify this point and stop exposing the entity to new debt well ahead of that point, to account for the risk of unwillingly drifting towards it, should the profitability slow down at a faster than expected pace or the cost of debt increase at a faster than expected rate. See figure 9.
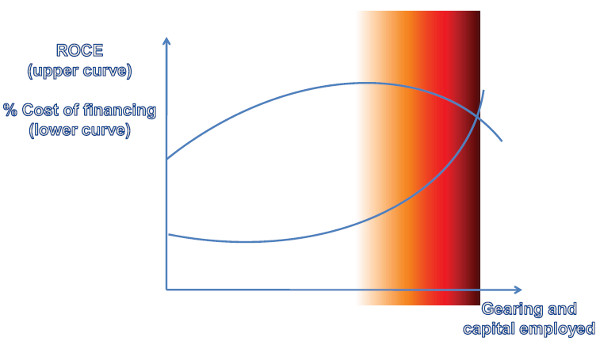
Figure 9 – the risk associated with gearing and the ‘danger zone’
You will be able to assess the appropriateness of your chosen entity’s gearing by comparing its gearing with the average gearing of its competitors and the average in the industry. Also, other ratios will complement this information: one of them is the ‘interest cover’, for example, which shows how many times the operating profit is larger than the cost of financing the entity, with the following formula,
Interest cover = operating profit / finance costs
You can choose to consider the ‘net finance cost’, i.e. finance cost deducted of finance income or purely the ‘finance cost’, based on whether the finance income is integral part of the normal financing activity of the entity or derives from an exceptional event.
Liquidity
Another effect of the combination of profitability, gearing and management of cash flows is the status of the entity’s liquidity. Liquidity represents the ability of the entity to pay for its current liabilities counting on its current assets. An entity that can honour its current liabilities (including not only trade creditors, but also interest and short term component of long term loans) by using its current assets is said to be liquid. An entity whose current assets are not sufficient to cover honour the current liabilities, but which as a consequence has to dispose of non-current assets or indeed repeatedly renew its short term loans (transforming them de facto in long term ones), is said to be illiquid.
The assessment of whether an entity is liquid or illiquid can be attempted by using a set of ratios: current and quick ratios, which compare the amount of current assets to the amount of current liabilities at a point in time, and the debtors’, creditors’ and inventory’s days, which measure the time it takes on average for the cash flows to enter or leave the entity from the day of their economic origin. The formulae are as follows:
Current ratio = current assets / current liabilities
Quick ratio = (current assets – inventory) / current liabilities
Debtors’ days = (trade debtors / sales) X 365
Creditors’ days = (trade creditors / purchases) X 365
Inventory’s days = (inventory / cost of sales) X 365
These ratios are not free from inconsistencies and limitations in their use. Among others:
- they refer to trade creditors and debtors, whilst we are interested in the whole of the cash flows, but this makes the results more reliable and meaningful;
- purchases are normally not given in the account, hence they must be constructed starting from cost of sales and adjusting for amortisation, depreciation and variation of inventories (see cost of sales in chapter 4 on income statement); and
- they should refer to more representative values of the debtors, creditors and inventory than the closing ones, e.g. annualaverages.
A general rule states that the current and quick ratios should be high enough to guarantee that the entity will be able to honour its current liabilities, but also low enough to prevent the entity from having capital tied up in non-productive investment, i.e. cash, debtors, inventory. However, what ‘high’ and ‘low’ mean depends on a number of factors: the entity’s strategy, its business, its industry and its monetary cycle. The latter refers to the timing of the cash inflows and outflows.
By combining debtors’, creditors’ and inventory’s days it is possible to work out the monetary cycle, i.e. how long it takes for the entity, on average, to transform a cash outflow in a cash inflow. See figure 10
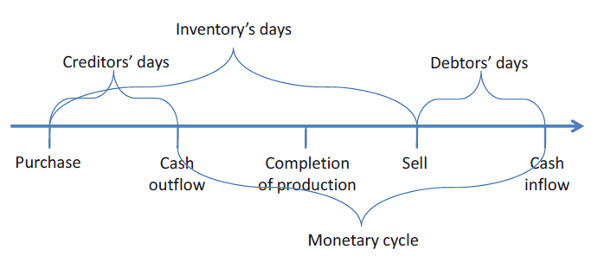
Figure 10 – a positive monetary cycle
Although the most normal situation is that entities show a positive monetary cycle, i.e. they spend cash before receiving cash from the related activities, hence they have a cycle made of a positive number of days, it is quite frequent in certain industries that the monetary cycle is negative. The meaning of this is that the entity receives cash for certain activities, in advance of spending it for the same activities.
This is typical of large retailer chains, which sell very quickly to customers who pay very quickly (often they pay contextually to the sale) and pay their suppliers long after having purchased from them. In this type of scenarios current and quick ratios below the value of 1, are perfectly acceptable, given that although the value of current assets at a given point is not enough to pay for the current liabilities at that given point, it is also true that those assets will be transformed in cash more quickly (hence more frequently) than those liabilities will fall due. See figure 11.
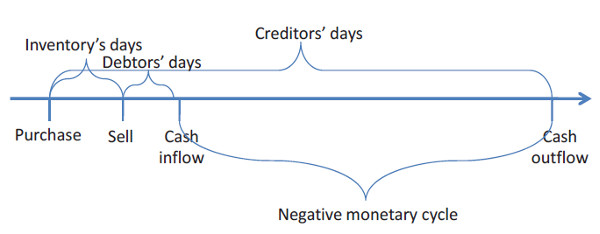
Figure 11 – a negative monetary cycle
Also, when performing a liquidity analysis, it is advisable, once again, that you refer to the entity’s strategy, to devise what values are appropriate and justifiable. For example, an entity whose business is to provide parts and components for aircraft maintenance and whose mission statement is to respond, with a less than 24 hour delivery, to any client’s request, will need to have very high inventory levels, which will make its current ratio abnormal in comparison with other entities operating in different fields.
A holistic and dynamic approach to analysis and interpretation
Although the process of analysis, by its very nature, is based on dissecting the various aspects of the entity’s performance and situation, in order to enable us to consider them in specific comparison with similar aspects of other entities (individually or in aggregations), we should not overlook the fact that the entity is one. As such every aspect of its performance and situation is linked to the others, in a complex interconnection of causes and effects, which are dictated by the entity’s declared strategy and the entity’s contingent facts, which might have significantly departed from the planned strategy, hence the analysis and interpretation must follow a holistic approach.
The implication is that any consideration about performance and situation must be supported by the evaluation of a number of different aspects. For example, when considering an entity’s ROE higher than the relevant competitors, an evaluation of the Gearing must be done to assess if that higher profitability bears a higher risk. The analysis will include the calculation of the interest cover, to assess the sustainability of that level of gearing. Also, it must be assessed how sustainable that profitability is, by evaluating the underling performance as opposed to the exceptional events and whether it comes from a configuration of volume and margin (ROS and ATO) that complies with the declared strategy.
Furthermore, every aspect of the entity is affected by a continuous change and transformation, hence the analysis must be based on a dynamic perspective. For example an entity that has just embarked in a fast paced expansion process, might have a seemingly plunging ROCE, caused by the distribution and other administrative costs needed for the expansion to take place. However, if the expansion has been successful and its Gross profit percent has remained at the desired level, it is likely that those costs that affected the ROCE will not occur again, leading to a restored ROCE and, consequent to the expansion, an improved ROE, subject to checking if the expansion was conducted by raising credit capital at a cost below ROCE or equity less than proportionally to the increase of the profit.
Finally, the business sustainability must be tested, given that the entity’s very existence might depend on its weakest aspect; whereby a profitable and solid entity might collapse for bad liquidity management, whilst an entity that seems to thrive might, in fact, being burning its resources and undermining its reputation on the market to an extent that endangers its medium and long existence.
Also, an entity might appear strong in every aspect of its performance and situation, but is hiding a miscalculation of the risk that it has taken on board and that is not fairly reflected in its accounts… and, to point your attention on how important this effect can be, you should recall that this is one of the widely accepted causes of the current global financial crisis.