Structural Evolution of the U.S. Economy
- Details
- Category: Macroeconomics
- Hits: 5,116
The structure of the American economy is evolving. Technology is one of the driving forces, both domestically and in integrating the U.S. economy with the global economy. The domestic economy does not operate in a vacuum.In a relatively open global economy, structural change in emerging economies causes structural change in advanced countries.
When a certain kind of activity declines in our economy, normally it does not just disappear from the global economy, but instead moves to another location. These powerful market forces operate directly on the tradable sector, and indirectly on the nontradable portion through wage and price effects and shifting opportunities in labor markets.
To divide the economy and its component industries into the tradable and nontradable parts, we used a methodology developed by Bradford Jensen and Lori Kletzer. Their approach determined the tradability of an industry based on its geographic concentration—the more concentrated the industry, the higher its tradability (and vice versa).
For example, take retail trade: its ubiquitous geographic presence implies that it is highly nontradable. The same could be said for dry cleaners, construction, and most health care. On the other hand, mining tends to be geographically concentrated, which points to its tradability.
Jensen and Kletzer’s classifications reflect domestic more accurately than international tradability. For instance, in legal services, domestic tradability and international tradability diverge. We adapted and adjusted their classifications by critically looking at each industry’s tradability estimate and using both common sense and export and import data to see whether their proportions reflect industries’ international tradability.
Generally, the divisions seem correct, certainly close enough that the larger picture of structural evolution would not be misleading. The details of the methodology and sources of data are described in appendix I. Many industries are entirely tradable or nontradable, though in most industries there is a growing set of service components that are in principle tradable.
We look at the shifting structure of the U.S. economy from 1990 to 2008, just before the crisis. We examine employment and value added overall and by the industrial sector. Then combining the two, we look at value-added per person employed, a number closely related to income.
Employment
Between 1990 and 2008, jobs have seen a net increase of 27.3 million on a base of 121.9 million in 1990. Hidden by this figure is a multitude of different employment trends across industries; the figures reported here are the net amounts. Almost all of those incremental jobs (26.7 of 27.3 million) were created in the nontradable sector. In the aggregate, tradable sector employment growth was essentially flat: some industries grew and others declined.
Within the period considered, employment rose for about a decade and then fell back to its 1990 starting level. As is clear in figure 4, the nontradable sector is large, and, in terms of share of total employment, became larger over time.

Figure 4. Tradable/Nontradable Jobs, 1990–2008
In terms of total changes over the sample period, the tradable sector saw a net increase in jobs of less than 1 million (figure 5).

Figure 5. Total Change in Jobs, 1990–2008
Nontradable employment
The large nontradable sectors are government, health care, retail, accommodation/food service (i.e., hotels, restaurants, and hospitality), and construction (see figure 6). In 2008, these accounted for 73.5 million jobs, 64 percent of employment in the nontradable sector and just under 50 percent in the whole economy.
Together, the top five nontradable sectors contributed 65 percent of the total increment in jobs from 1990 to 2008. Government at all levels is the largest employer in the nontradable sector and accounts for more than 22.5 million jobs in 2008. Health care is a close second, with an end of period total of 16.3 million. In terms of increments, health care’s growth of 6.3 million jobs tops the list and the government’s addition of 4.1 million comes in second.
These two increments combined produced almost 40 percent of the total net incremental employment in the economy since 1990. For later discussion, we note that government employment is not driven primarily by market forces, and health care is something of a hybrid. Market forces do operate in health care, but with large informational asymmetries and substantial public-sector participation on the demand side and in regulation.
In both government and health care, there are at least some questions about their future ability to be to primary drivers of employment growth. Figures 6 and figure 7 present trends in the nontradable sector. They include nontradable components of industries such as finance and insurance, even though most of these industries are tradable.
To ensure that the data are viewed in context, industries that are not predominantly or entirely nontradable include an asterisk. We have no way at present of isolating employment growth or the decline in the tradable and nontradable subcomponents of an industry that is a mixture. We therefore simply allocate the increase or decline in employment (or later value added) to the tradable and nontradable parts based on the fraction of the industry estimated to be on each side.6
This is unlikely to be accurate, at least for declines; declines are more likely to occur in the tradable subcomponent. The declines in the nontradable part therefore should not be taken too seriously. Fortunately, they are relatively small and do not substantively affect the overall picture. We detail our methodology in appendix II

Figure 6. Nontradable Industry Jobs, 1990–2008
For ease of viewing, smaller nontradable industries on a different scale are included in figure 7. Again, the reader will notice that certain categories—like Manufacturing III, which consists of largely capital-intensive manufactured tradable goods, such as heavy machinery—include a nontradable component.

Figure 7. Nontradable Industry Jobs, 1990–2008
Tradable employment
The tradable part of the economy presents a different picture. Employment in different industries shows increases and declines, which net to a positive but very small number. Figure 8 shows the larger or major tradable sectors across three groups of manufacturing (see table 1).
Table 1. Description of Manufacturing Industry Splits
| Manufacturing I | Food, beverage, and tobacco production; textile, apparel, footwear, and leather goods |
| Manufacturing II | Wood and paper products; petroleum and coal; basic chemical products; synthetic materials; nonmetallic mineral products; glass; and cement products |
| Manufacturing III | Primary and fabricated metal products; heavy machinery; transportation equipment; computers and electronics; household appliances; semiconductors; and furniture production |
In Manufacturing III, we isolated electronics, autos, and other transportation (aero, rail, and ships) to get a closer look at these industries. In Manufacturing II, we isolated pharmaceuticals. Sticking with the methodology just described, those industries that are not predominantly tradable have an asterisk to indicate that most of the industry is on the nontradable side.

Figure 8. Tradable Industry Jobs, 1990–2008
The pattern is mixed but clear. The manufacturing sectors declined substantially in employment in all three groups. Manufacturing III accounts for the largest drop in jobs between 1990 and 2008 (2.2 million). Major industry job loss was in the electronics industry (650,500), aerospace (337,400, see figure 9), and the auto industry (172,400).
Manufacturing I accounts for the second-largest drop over the period (1.3 million). In this sector, major industry job loss came from cut-and-sew apparel manufacturing (597,300), and fabric mill (203,000). Manufacturing II accounts for the third-largest drop (880,400), driven by the paper (-438,000) and chemical industries (-165,600).
Agriculture also posted losses of 535,000 jobs. Parts of agriculture are highly capital intensive but others (like fruit and vegetables) remain labor-intensive. The most notable increases in major tradable industries were in finance and in architectural and engineering services. The tradable portion of the information—the telecommunications, data hosting, broadcasting, motion picture, recording, and publishing subindustries—rose overall, but experienced a sharp rise and fall during the Internet bubble.
Among the smaller tradable sectors and industries (figure 9), computer systems design experienced the most striking growth, with a temporary reversal around the end of the Internet bubble.
Management, scientific, and technical consulting along with accounting and tax preparation, business support services also showed impressive employment gains. Interestingly, pharmaceutical employment rose (83,500), counter to the trend in much of the rest of manufacturing.
Mining declined and then rose for a modest net gain overall. This is probably driven by the pattern of general commodity prices, which first fell and then rose as growth in emerging markets drove prices up.

Figure 9. Tradable Industry Jobs, 1990–2008
Value Added
If a company performs a service internally at one point in time, and then at a later point, purchases the service from an outside source, then the value added by the company (other things equal) falls because a service has been created outside— that part of value added becomes a purchased input.
Similarly, when a domestic industry moves some part of the supply chain to another country, the value added in the outsourcing country will fall, even though the final sales of product may remain the same. In short, value added can decline either because the industry is in decline or because more of the value added is created by different companies, countries, or both.
We call it outsourcing when the function is performed by another company and off-shoring when the function is performed in another country. Clearly offshoring is possible without outsourcing (a multinational company moves the activity to another country but continues to perform the function itself), as is outsourcing without offshoring (the function is performed domestically but by another company), as is offshore outsourcing.
All elements of this grid can be found in advanced economies, and in the global economy. The evolution of the economy suggested by the employment data is really quite different from that painted by the value-added data. The methodology employed here is similar to that for employment. Value added is allocated to the tradable and nontradable sectors.

Figure 10. Tradable/Nontradable Value Added, 1990–2008
Figure 10 depicts the value added in the economy in constant 2005 dollars for the tradable and nontradable sectors. Total value added is close to the GDP of the economy. Valued added in the tradable and nontradable parts of the economy grew at similar rates. In fact, the tradable sector, though smaller than the nontradable, grew slightly faster and hence marginally increased its share of total value added, in marked contrast to the employment trends.
Nontradable value added
Figure 11 depicts the trends in value added in the major sectors of the nontradable part of the U.S. economy. As before, the government is large and expanding, with a 16 percent increase in value added from 1990 to 2008. The real estate, rental, and leasing industry grew from $1 trillion in 1990 to $1.7 trillion by 2008, a 49 percent increase.
Postcrisis, it has undoubtedly become smaller. Health care (+40 percent), wholesale (+90 percent), and retail (+60 percent) all grew. Construction value added peaked around 2000, earlier than its 2006 peak in employment. Accommodation and food (hotels, restaurants and foodservice) also grew in value added, but what is perhaps striking is its relatively small size in value compared with its share of employment: in 2008, the industry accounted for 10 percent of jobs in the nontradable sector, but only 4 percent of nontradable value added. This, of course, means that value added per employee will be relatively low in this sector, as inevitably wages and incomes will also be.

Figure 11. Nontradable Value Added, 1990–2008
The minor nontradable sectors are presented in figure 12. Substantial increases from 1990 to 2008 are visible in information (+91 percent), management of companies and enterprises (+25 percent), and in business and administrative support services (+79 percent).

Figure 12. Nontradable Value Added, 1990–2008
Tradable value added
The most interesting data concern the value-added trends in the tradable part of the economy. The major tradable sectors (shown in figure 13) deserve careful scrutiny. One might have expected that the trends in value added would be similar to those for employment, some rising and some declining. But in fact, the pattern is mostly increasing value added across industries.
In parallel with increases in employment from 1990 to 2008, tradable value added also increased in finance and insurance (+56 percent); professional, scientific, and engineering services (+72 percent); and information (+91 percent). But the manufacturing sectors, where employment declined, all show increases in value added—manufacturing I, 8 percent; II, 27 percent, and III (excluding electronics, auto, aero, and naval), 17 percent.
The only two major sectors to register a decline were other transportation (which includes aero, rail, and naval), 19 percent, and mining, 49 percent.
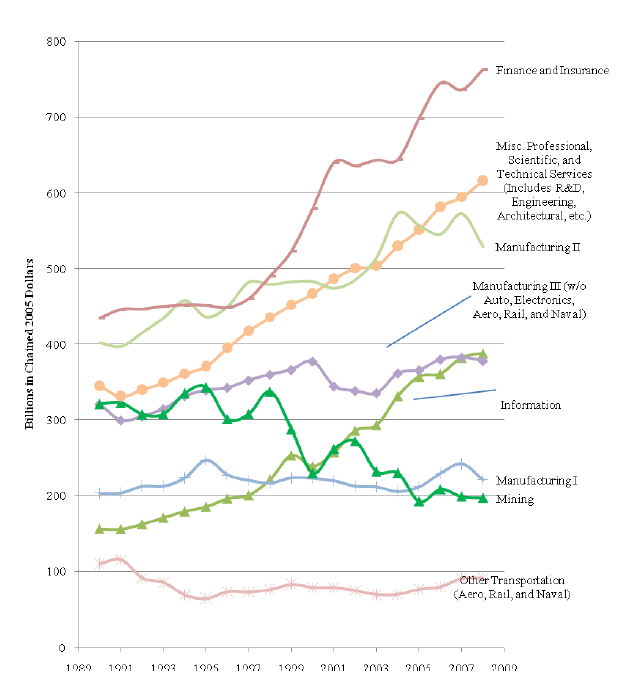
Figure 13. Tradable Industries’ Value Added, 1990–2008
Switching to the smaller value-added sectors (figure 14), value added in computer systems design grew along with employment. But the largest increase occurred in electronics (+363 percent), which is a declining employment sector. The explosive growth in electronics sales and value added is not a surprise given the growth in demand for computers, cell phones, and many other devices that connect to the Internet.
Declining employment in electronics in the United States, despite the high growth in value added, is explained by the offshoring of a growing number of parts of the value-added chain, ranging from labor-intensive assembly to semiconductor manufacturing and design, and even to product development.
So here we have the classic case: industry growth is high and value-added growth is high because the high value-added portions of the supply chains have remained in the domestic economy. Meanwhile, the lower value-added portions migrate off shore, explaining declining employment.
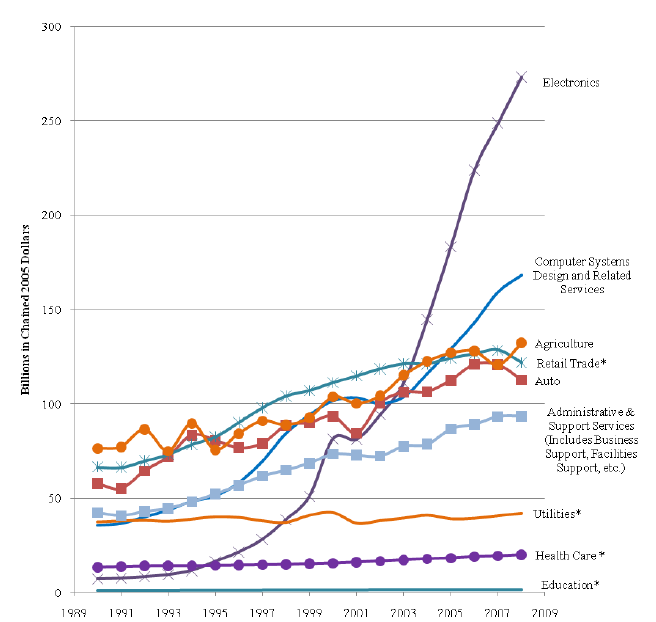
Figure 14. Tradable Industries’ Value Added, 1990–2008
To summarize, in some sectors—largely services—the U.S. economy continues to have a comparative advantage. In them, employment and value added grew together. But in another class of industrial or manufacturing sectors, value added rose and employment declined. The explanation for this pairing in the context of the global economy and the shifting characteristics of the emerging economies is not hard to uncover.
Parts of the value-added chain in these industries are moving to other countries, prominently the emerging economies. The parts that are moving are those with lower value added per person. As the emerging economies grow and mature, competition will move up the value-added chain. This has been going on for some time.
Value Added per Person Employed (or per Job)
You can put the employment and value-added data together and look at value added per person employed, in the economy as a whole, in the tradable and nontradable sectors, and industry by industry.
In 1990, value added per person employed (VAP) in the tradable and nontradable sectors was rather similar, the tradable sector at almost $80,000, roughly $10,000 above the nontradable figure (see figure 15). But the value added per person employed on both sides diverged slowly during the 1990s and then rapidly after 2000. VAP in the tradable sector grew at an average of 2.3 percent per annum, and the nontradable sector at 0.7 percent. By 2008, VAP in the tradable sector was just over 50 percent above that for the nontradable sector.
As noted earlier, there are two kinds of sectors in the tradable category. In manufacturing supply chains, the lower value-added components are going offshore. These chains saw declines in employment and rising value added, which implies a sharply rising pattern of value added per employee. In the second kind, employment and value added increased together.
These tend to be high-end services in which the U.S. economy continues to enjoy a competitive position or better. In this set of sectors, one would not know in advance, by the logic and arithmetic, whether value added per person employed would rise or fall. In fact, VAP seems to have risen in most of them. These are growing sectors where both value added and VAP are increasing together; here, the value added chain is not (or not yet) migrating to other parts of the global economy.
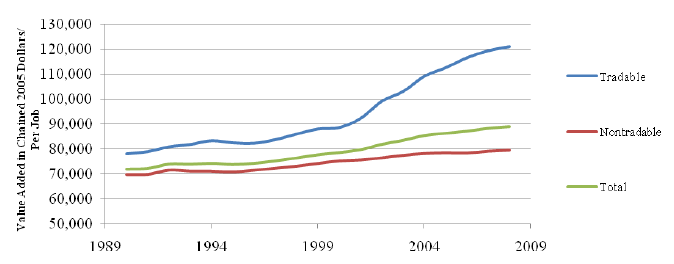
Figure 15. Value Added per Job, 1990–2008
Tradable value added per person
Figures 16 and 17 depict value added per person employed by industry in the tradable sector. Figure 16 (majors) presents those with a starting value of above $100,000, and figure 17 all the rest (minors). Mining and utilities are highly capital-intensive industries, hence the high value added per employee.
In addition, utilities are mostly nontradable, with a small number of components that are tradable. From 1990 to 2008, VAP rose in finance and insurance (+38 percent), utilities (+40 percent), and other transport (+20 percent), but fell in mining (-54 percent).
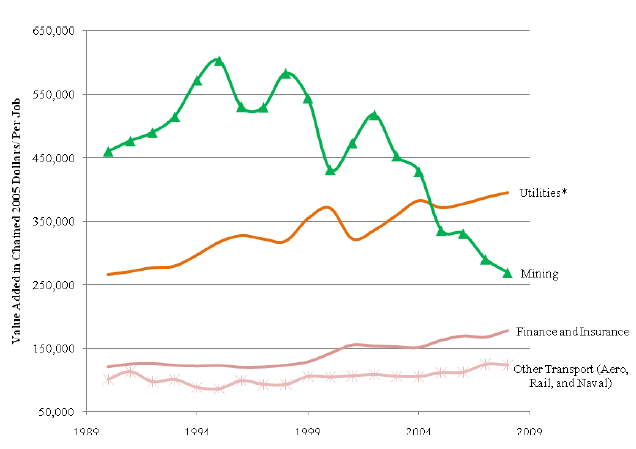
Figure 16. Tradable Industries’ Value Added per Person, 1990–2008
But the large increases are observed in figure 17. These tradable categories experienced, for the most part, rising VAP, including both the declining employment manufacturing industries (as expected, because value added was increasing) and the services sectors with rising employment, where the VAP figure could have risen or fallen. In fact, VAP is rising rapidly in these high-end service sectors, particularly in the information industry (+67 percent).
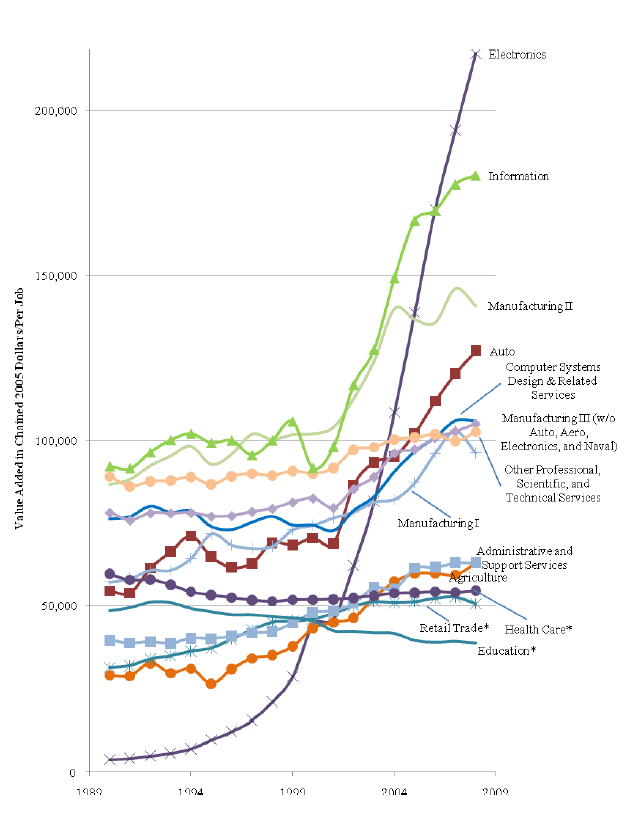
Figure 17. Tradable Industries’ Value Added per Job, 1990–2008
The most noteworthy rise in VAP was in electronics, from roughly $4,000 in 1990 to more than $200,000 in 2008, a 405 percent increase. Of course, the low VAP in 1990 needs to be put in proper context; its extremely low level is a statistical artifact, reflecting the construction of the real value added data using 2005 as its benchmark.
Early consumers of personal computers will recall the exorbitantly high prices of electronics in the early 1990s by today’s standards; since then, prices have fallen dramatically year after year (see figure 18). Costs fell with them (for comparable amounts of computing power), the economic effect of the operation of Moore’s law. Basically, the value-added data do not reflect what consumers actually paid for the products in the early years.
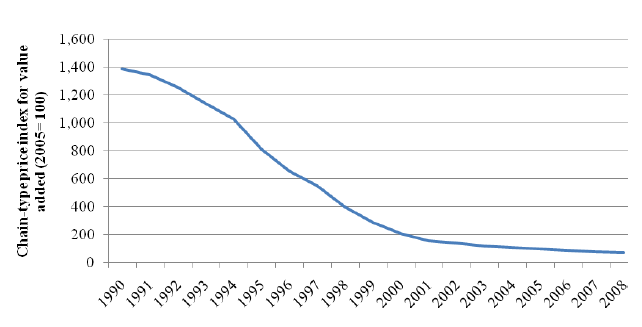
Figure 18. Computer and Electronics Chain-Type Price Index for Value Added (2005=100)
For perspective, the nominal VAP in 1990 was roughly $52,000, far above the real VAP of roughly $4,000. The details of this industry’s rise are discussed in more detail in an appendix.
Nontradable value added per person employed
The nontradable VAP is shown in figures 19 and 20. In the higher VAP group, both the levels and rates of increase of real estate, rental, and leasing services are striking. Presumably, some of this observed trend was related to the real estate bubble that preceded the crisis. Real estate, rental, and leasing is a rising employment industry and a substantial one (accounting for 2.6 million nontradable jobs in 2008), but its growth in value added from 1990 to 2008 (+49 percent) exceeded its job growth, resulting in a rise in VAP of 27 percent.
Utilities as a group are capital intensive and rising labor productivity may be related to increased capital intensity and to information technology advances that automate some of the control systems. Its VAP rose by 40 percent. Information and finance and insurance are largely tradable; here we are seeing mainly tradable gains reflected on the smaller nontradable side. Interestingly, legal services, which is largely though not entirely nontradable at this stage, shows a slightly declining pattern (-11 percent from 1990 to 2008).
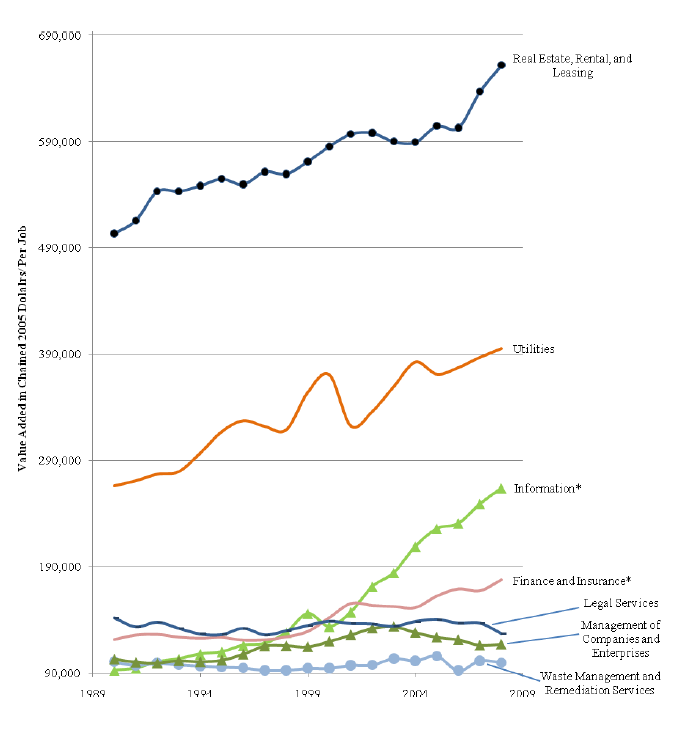
Figure 19. Nontradable Industries’ Value Added per Job, 1990–2008

Figure 20. Nontradable Industries’ Value Added per Job, 1990–2008
A few aspects of the nontradable VAP data are worthy of note. As mentioned earlier, the giant employers in the nontradable sector are government and health care. Both are experiencing declining VAP (-4 percent for government, -9 percent for health care). Construction’s VAP also declined by 19 percent from 1990 to 2008. The dominance of these sectors causes the declining VAP to overwhelm any sectors in which it is increasing.
The result is the modest growth of VAP on the nontradable side of the economy (about 0.7 percent per year). Moreover, government and health care employ large numbers of workers in the midrange of the income distribution. Declining VAP in these sectors has had the effect of depressing middle income growth and increasing income inequality, as the high end rose faster. Wholesale trade’s VAP expanded very rapidly in the 1990s, reflecting dramatic increases in productivity and flat employment growth.
According to a 2002 Bureau of Labor Statistics study, the industry’s productivity boom was caused by three factors:
- improvement in technology, specifically the introduction of systems like the Electronic Data Interchange (EDI);
- Internet communication to buy and sell products;
- rapid expansion in the size of wholesale businesses and the adoption of new business models.
Accommodation, food service, and administrative and support services have low VAP. Even when discounting for part-time work, the figures are low. Moreover, accommodation and food service are high and rising employment sectors, so their low VAP further explains wage stagnation.
Education has experienced declining VAP, as has construction, another high employment sector. A possible reason for the declining VAP in these sectors is the wage effect of increased competition for nontradable jobs, because jobs in the tradable sector were flat and the employed population continued to grow. Government VAP is essentially flat, perhaps because the government sector is relatively insulated from the price effects of excess labor supply.
A Brief Summary
In summary, over the past twenty years in the U.S. economy, some parts of the tradable sector grew in value added and employment (e.g., the finance, insurance, and computer systems design industries) whereas others grew in value added but declined in employment (e.g., the electronics and auto industries).
The former are where most of the value-added chain is in the upper range in terms of value added per employee. The latter are sectors, like manufacturing, with a range of value-added components. In these, the lower value added per employee portions moved offshore, causing a decline in employment and leaving the higher value-added parts that remain competitive and thrive by operating in a global economic environment with access to high-growth emerging market economies and expanding commercial and business opportunity.
Overall, the tradable sector generated negligible incremental employment. Yet the economy did not have an unemployment problem, at least until the crisis of 2008. The expanding labor force was absorbed in the nontradable sector (roughly 26.7 out of a total of 27.3 million net new jobs), government and health care leading the growth (10.4 million incremental jobs between them). In our view, it is unlikely that this pattern will continue. Chances are good that the pace of employment generation on the nontradable side will slow.
Fiscal conditions, the costs of the health-care sector, a resetting of real estate values, and the elimination of excess consumption all point to the potential for a longer-term structural employment problem. Expanding employment in the tradable sector almost certainly has to be part of the solution. Otherwise, the United States will have a longer-term employment problem.